Usage statistics
See what every app and dashboard costs to build and run, how much it is used, what an Ask answer costs and whether the AI bill matches the ledger.
Usage & cost answers three questions an IT admin gets asked every month: what does this app or dashboard cost us, is anyone using it, and where did the AI budget go? It is a tab of the Overview page, next to Overview and Health.
Who can do this
Admins of Cortex Control. The tab is not shown to anyone else. Open Overview and choose Usage & cost. For the Overview page itself, see Overview and health.
All amounts are estimates: the tokens that were used, multiplied by the model prices under AI engine. While the prices there are not marked as real rates, the money columns say est. in their heading.
The tab at a glance
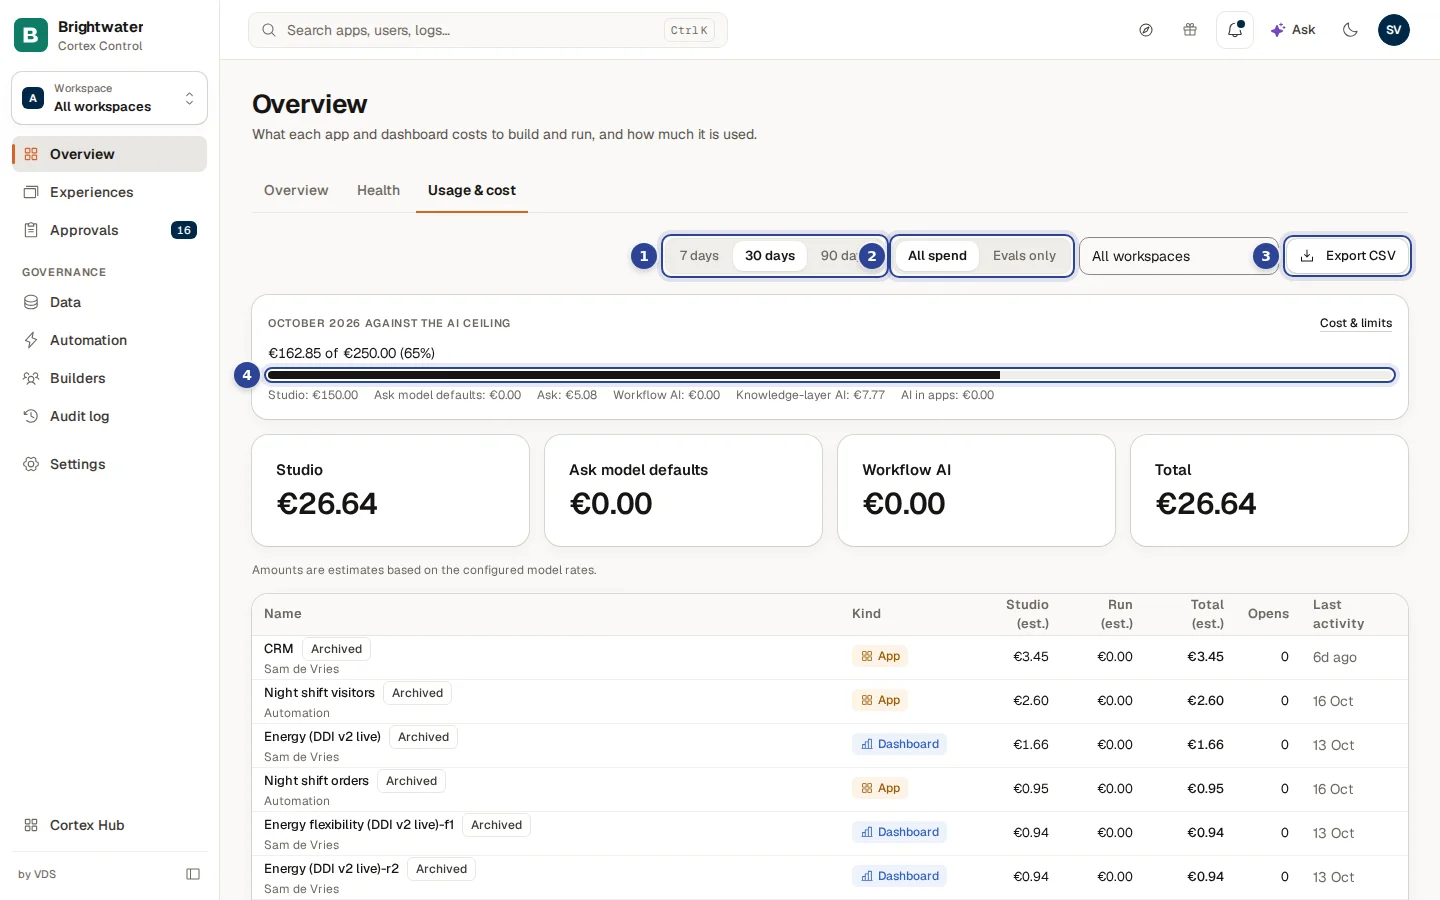
- Period. Show the last 7 days, 30 days or 90 days. The default is 30 days.
- Spend. All spend shows everything; Evals only shows only the money spent on approved evaluation runs (see below).
- Export CSV. Downloads the report as a spreadsheet file.
- The month against the AI ceiling (the block is titled with the month, for example "October 2026 against the AI ceiling"). The same month-to-date bar as on Cost & limits, with the spend per source. Choose Cost & limits in the corner of the block to change the ceiling.
When your organisation uses workspaces, a fourth control appears left of the export button: Filter by workspace.
A build session, an Ask answer, a workflow AI step, an app's own AI call.
Tokens per call, kept in a ledger per source.
Tokens times the rates under AI engine: an estimate.
Per app, per month, per workspace and per Ask answer.
Read the totals and the table
Under the ceiling block you see four figures for the chosen period: Studio (what building cost), Ask model defaults, Workflow AI and Total.
Under them the report lists every experience, one row each.
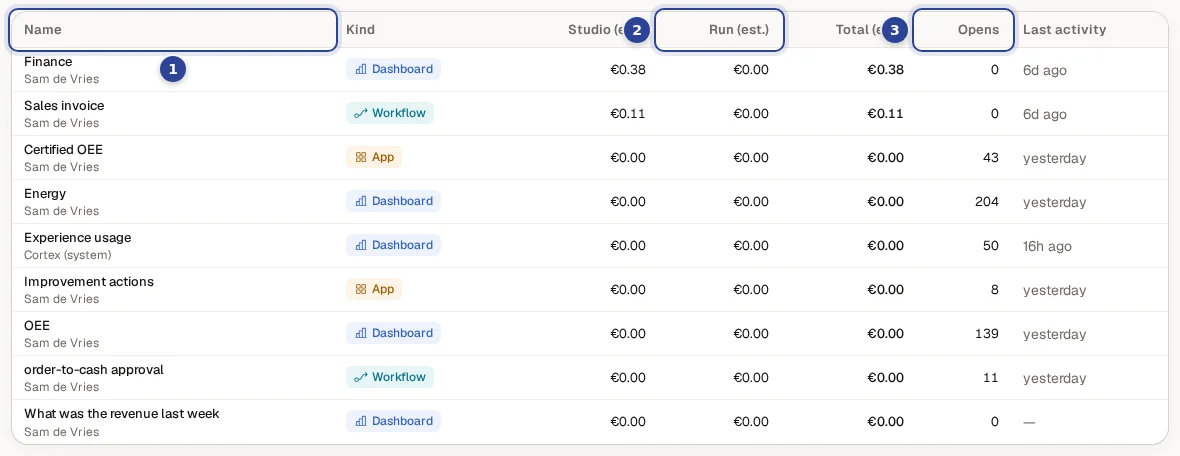
- Name. The experience, with its owner underneath ("No owner" when it has none) and an Archived badge when it was archived.
- Run. What running it cost: the AI used by Ask and by workflow steps. When both are present, the parts are shown under the figure ("Ask … · workflows …").
- Opens. How many times people opened it in the period.
| Column | What it shows |
|---|---|
| Name | The experience and its owner. |
| Kind | Dashboard, app or Workflow. |
| Studio | The estimated cost of building and changing it in Studio in the period. |
| Run | The estimated cost of its AI use in the period. |
| Total | Studio plus Run. |
| Opens | How often it was opened in the Hub. |
| Last activity | How long ago it was last used. Hover to see the exact moment. A dash means no activity. |
Things the page tells you in words
- "No experiences yet." The list is empty.
- "No usage recorded yet: opens appear once people open an experience in the Hub; Ask spend appears once Ask answers questions."
- "Build spend could not be read from Studio right now, so only run figures are shown." and "Workflow AI spend could not be read right now." A source was unreachable: the totals miss that part until it is back.
- "… of workflow AI spend is not tied to an experience; it is in the totals but in no row." Spend of a workflow that belongs to no experience is in the Total but has no row.
- "Amounts are estimates based on the configured model rates."
Spend per month and per workspace

Per month lists the months in the period, newest first: the total, and between brackets Studio and Run. Use it to see whether the spend grows.

With workspaces, By workspace shows one line per workspace: Experiences, Studio, Run, Total and Opens. Experiences that sit in no workspace are on the line No workspace. It is an overview, not a budget: there is no spending limit per workspace.
Choose a workspace under Filter by workspace to see only its experiences and totals. What cannot be tied to a workspace (workflow AI with no experience, the month history and the ceiling block) is left out of a filtered view instead of being shown under a workspace's name. Export CSV always exports the whole organisation. See Workspaces.
What does an Ask answer cost?
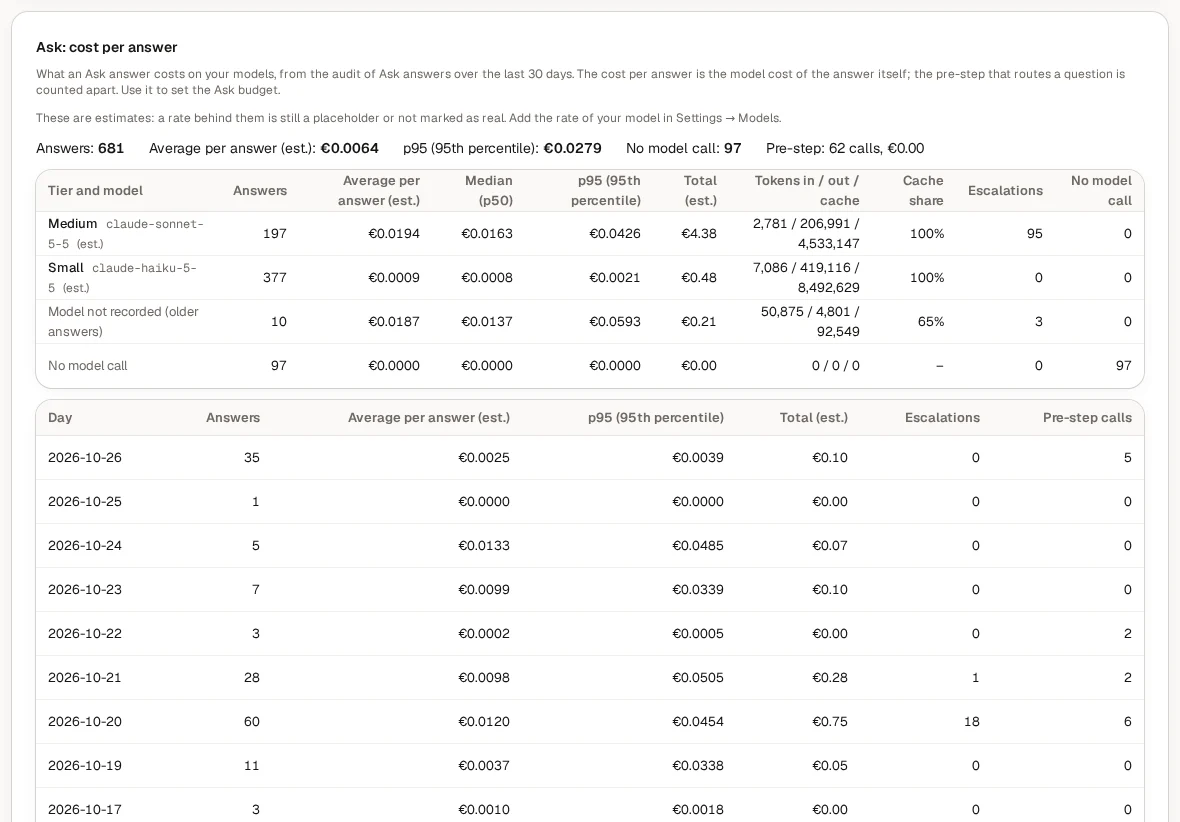
Ask: cost per answer shows what an answer costs on the models you run, measured from the answers of the last days of the period. Use it to decide on the Ask budget on Cost and limits.
The summary line: Answers, Average per answer, p95 (95th percentile) (95 in 100 answers cost less than this), No model call (answers that needed no AI at all) and Pre-step (the calls and cost of the small step that routes a question, counted apart).
| Column (per tier and model) | Meaning |
|---|---|
| Tier and model | The tier (small, medium, large) and the model behind it. "No model call" and "Model not recorded (older answers)" are separate rows. |
| Answers | How many answers were counted. |
| Average per answer / Median (p50) / p95 (95th percentile) | The cost of one answer, to four decimals: a single answer costs a fraction of a cent. |
| Total | The cost of all those answers. |
| Tokens in / out / cache | How many tokens went in, came out and were read from the cache. |
| Cache share | The share of input read from the cache: higher is cheaper. |
| Escalations | How often a question was handed to a stronger tier. |
| No model call | Answers given without calling a model. |
The second table gives the same per day (Day, Answers, Average per answer, p95, Total, Escalations, Pre-step calls). If there are more answers than the report reads, it says so ("There are more answers in this period than the report reads; the oldest are left out."). With no answers: "No Ask answers in the last … days yet."
Does the bill match the ledger?
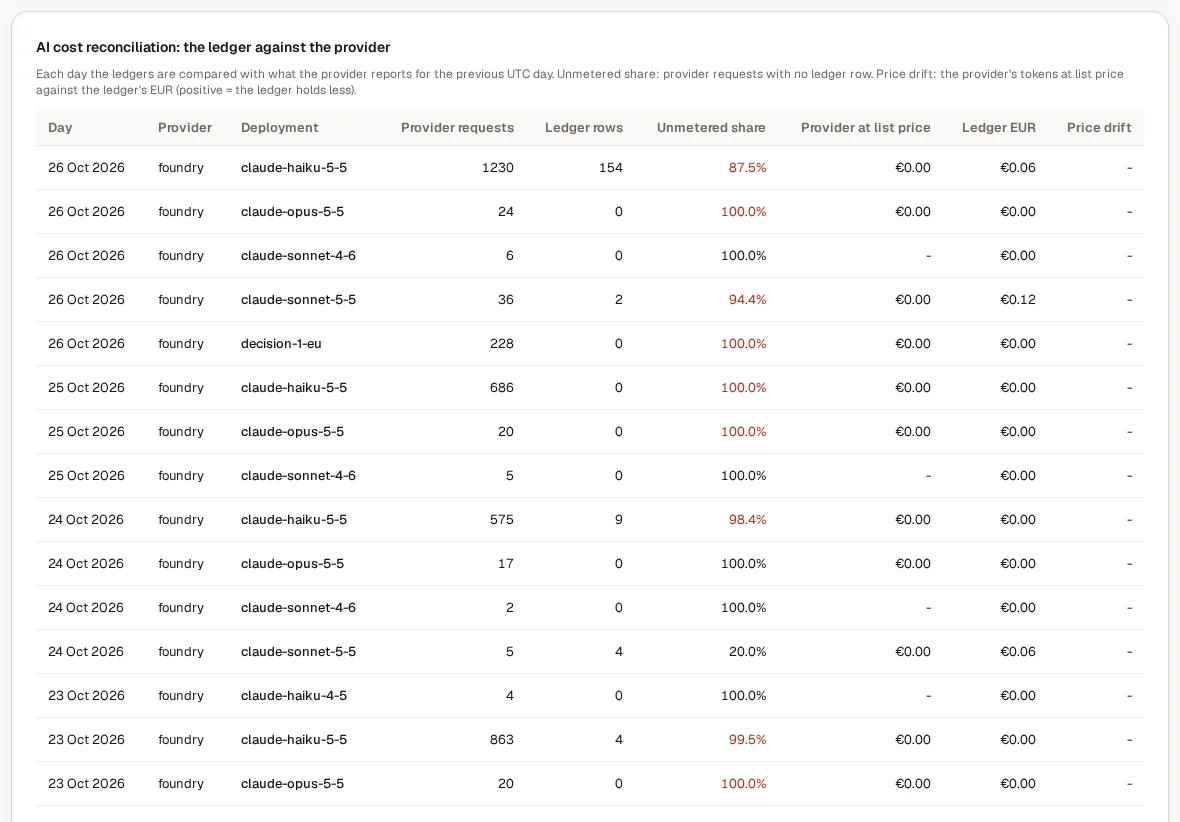
AI cost reconciliation: the ledger against the provider compares, each day, what Cortex counted with what your AI provider reports for the previous day (UTC). The first run happens at the next daily job ("No reconciliation has run yet. The first run is the next daily job."). It covers at most the last 30 days.
| Column | Meaning |
|---|---|
| Day, Provider, Deployment | Which day and which model deployment. |
| Provider requests | How many requests the provider saw. |
| Ledger rows | How many Cortex counted. |
| Unmetered share | Provider requests with no ledger row. Shown in red above 5% (with at least 20 provider requests that day). |
| Provider at list price | The provider's tokens, at list price. |
| The ledger amount | What the ledger holds for the same requests, in the currency of the report. |
| Price drift | The difference between the provider's list-price amount and the ledger amount. Positive means the ledger holds less. Red above 25%. |
A row that cannot be checked says Not reconciled, with the reason: "no access to the provider's usage data", "not configured", "the provider's usage could not be read" or "the provider exposes no usage; the ledger is the only figure". Ledgers Cortex does not read yet are listed under the table; the ledger side is then a lower bound, so only a ledger above the provider is flagged. A deployment that is over a threshold also appears under Needs attention on the Overview.
Evals only
Choose Evals only under Spend to see the money spent on approved evaluation runs, apart from people's own use.
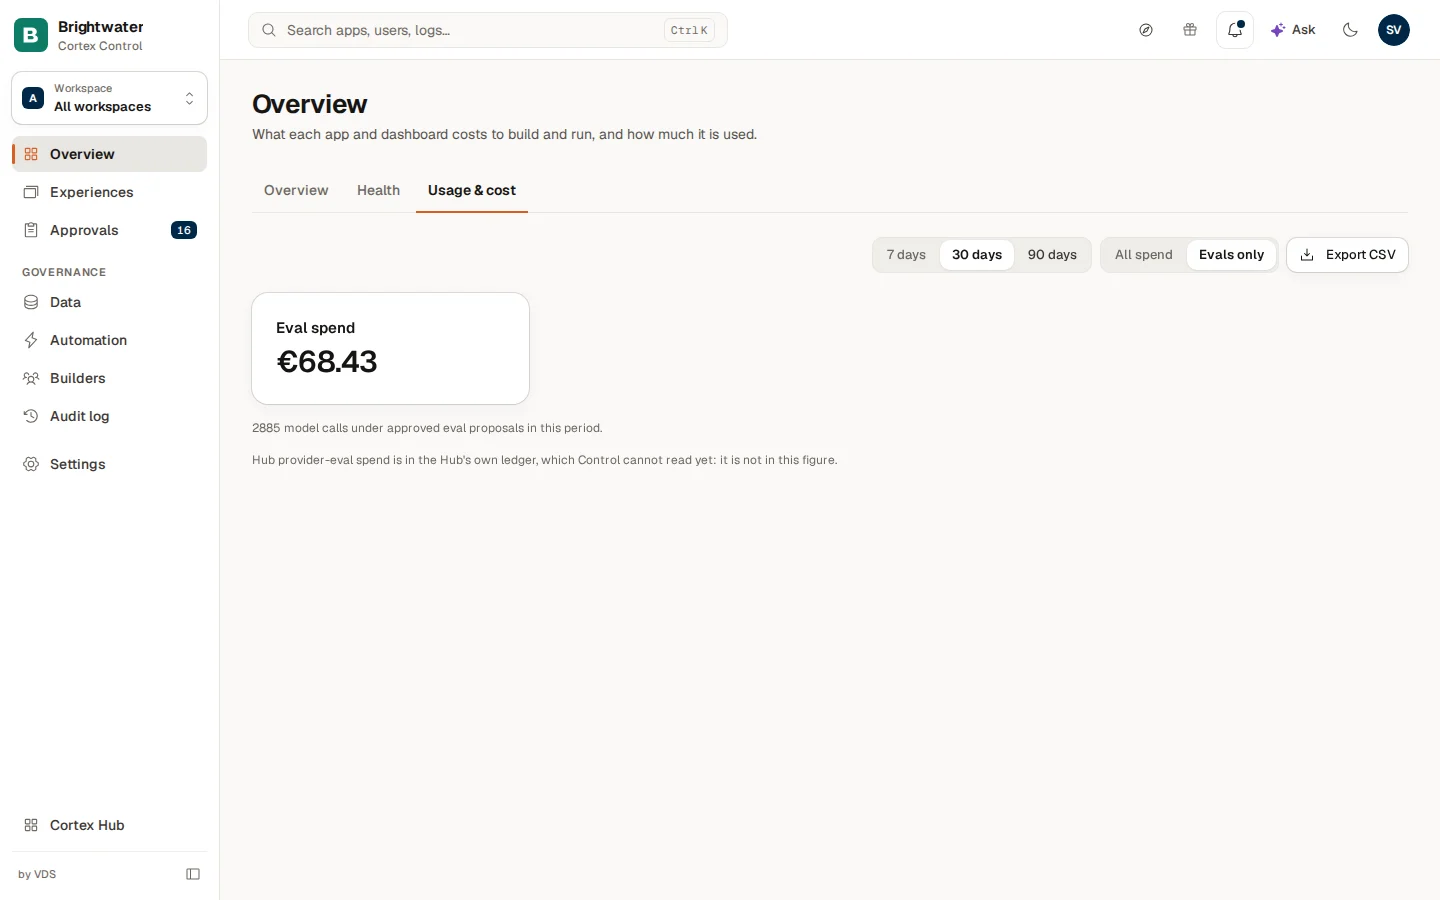
You see Eval spend and "… model calls under approved eval proposals in this period". The note below it explains that the Hub's own evaluation spend is in the Hub's own ledger, which Control cannot read yet, so it is not in this figure. The workspace filter and the other blocks are hidden in this view.
Usage on one experience
- On the page of an experience, an owner or admin sees the card Usage & cost with the same columns for the last 30 days.
- View usage (Bekijk gebruik in Dutch) on that page opens the Hub's usage dashboard for that one experience in a new tab. It shows who opens it and how often, under the access rules of that dashboard.
- Expected use (monthly, quarterly, yearly or not set) tells Cortex how often an experience is meant to be used, so a quarterly report is not flagged as idle after a month.
- The Clean-up view of the experience list collects the experiences that are unused, slow to open or have no active owner.
See Experiences for these.
Example: is the old production dashboard still worth it?
Sam de Vries at Brightwater Foods is asked to cut the AI bill.
- Sam opens Overview, then Usage & cost, and chooses 90 days.
- In the table Sam sorts out the rows with a high Total and few Opens.
- Sam opens one of them, uses View usage to see who looked at it last month, and asks the owner whether it is still needed.
- If not, Sam archives it from the Clean-up view.
- A week later Sam looks at Per month to confirm the trend went down.