Answer and follow a figure
Ask a question, open the dashboard behind the answer, change the period, keep the value on Home and get a line in the bell when it crosses your limit.
In this guide Sam de Vries, a planner at Brightwater Foods, wants to know how much energy the factory used last month. Sam asks Cortex, checks the answer on the Energy dashboard, keeps the key figure on Home and sets an alert, so that the next time the peak goes over the contract Cortex tells Sam instead of the other way round.
You end up with a figure you understand, a value on your Home that is always up to date, and an alert in the notification bell. Nobody has to build anything: you use what your builders already published.
You type the question on Home.
You check the figure, the period and the source.
You change the period and look closer.
One tile value stays on your Home.
An alert puts a line in the bell.
Before you start
Who can do this
Everyone who can sign in to Cortex Hub. You need access to the dashboard you want to follow: you only see dashboards that were shared with you. For an email alert your organisation must have connected Microsoft 365. Without it, choose the Hub bell, as this guide does.
The steps
Ask the question (everyone, on Home)
Open Home in the menu on the left. In the question box ("Ask Cortex about your data, or how Hub works") type "energy use last month" and press Enter. Name the figure and the period, in your own words: you do not need to know table or column names. While Cortex works you see what it is doing, and you can choose Stop.
Details: Ask Cortex.
Read the answer and its source (everyone)
The answer opens as a conversation: one sentence with the figure and the period, a figure card, and under it the details.
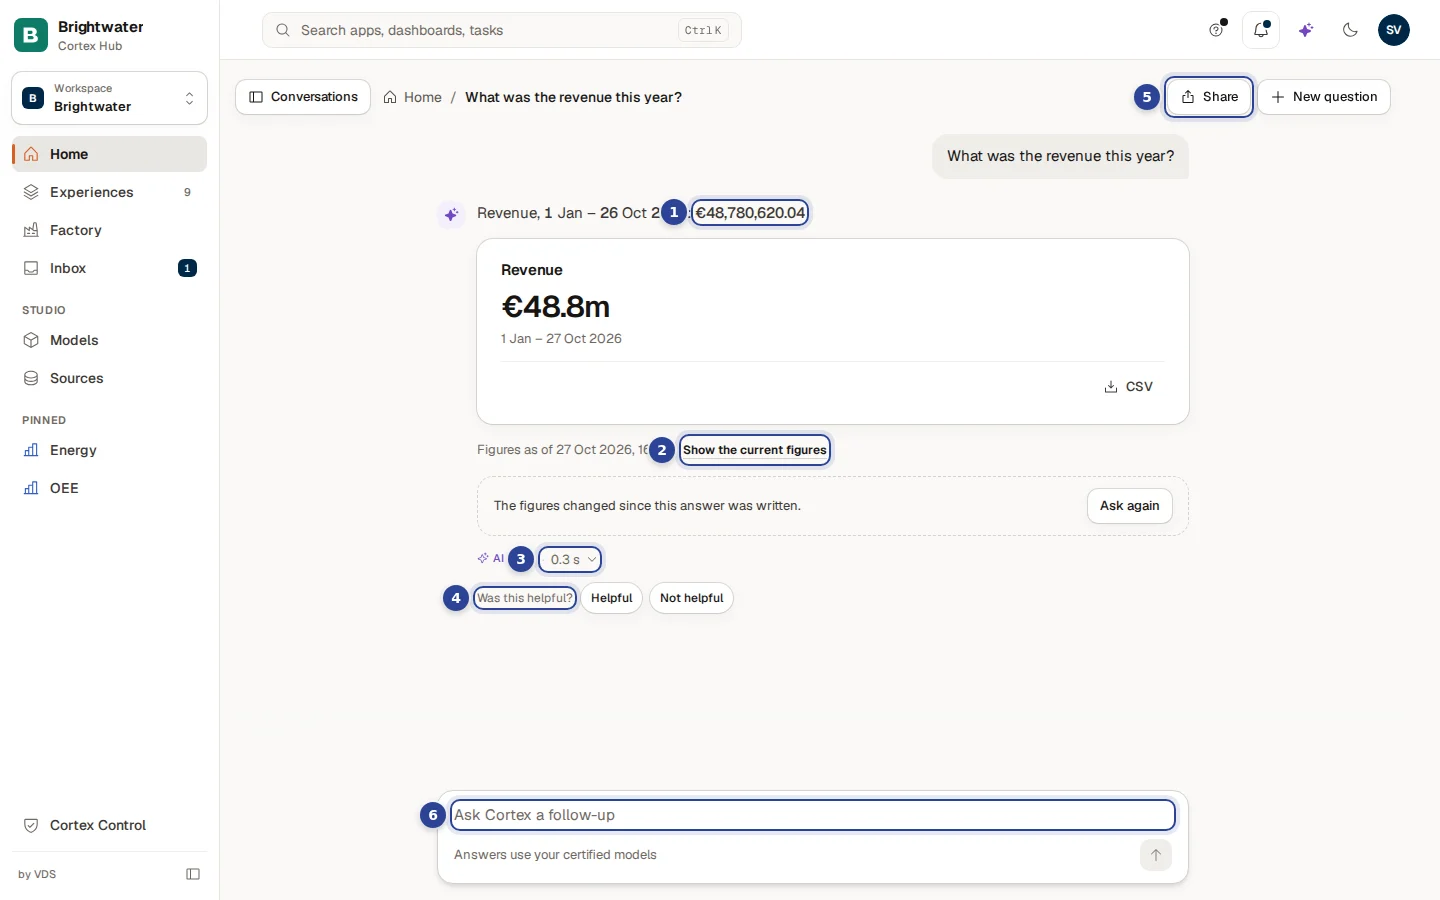
- The answer in one sentence, with the exact figure and period.
- Show the current figures: run the same question on today's data.
- The details, with how long it took and what it cost.
- Helpful and Not helpful.
- Share: copies a link that asks the same question for whoever opens it, with their own access.
- A follow-up box, for example "and per month?".
Check the period first. A label Certified figure means your organisation checked the number against the source. See Certified figures.
Open the dashboard behind it (everyone)
When the answer matches a dashboard, the answer offers Open in …. Choose it to land on the dashboard that shows the same figure. You can also find it yourself: open Experiences, choose Dashboards under the type filter and select Energy.
Details: Use a dashboard.
Change the period (everyone, on the dashboard)
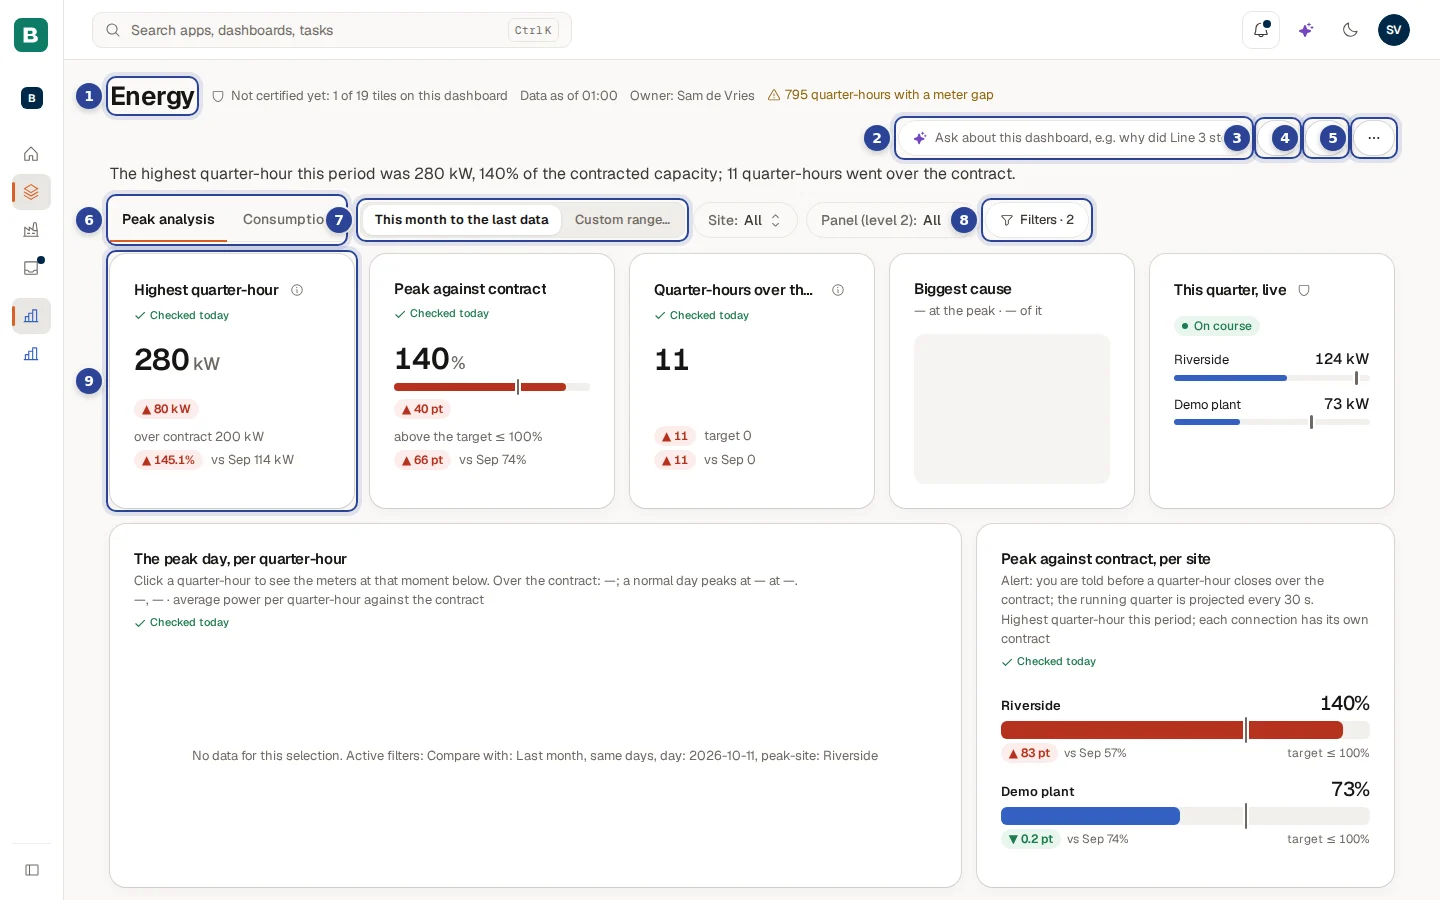
- The title, Data as of … and the owner.
- The Ask field of this dashboard.
- Subscribe (the bell).
- Pin (the pin): puts the whole dashboard under Pinned in the menu.
- More actions (the three dots).
- The page tabs, here Peak analysis and Consumption.
- The period control, here This month to the last data and Custom range….
- Filters.
- A tile.
Pick a ready-made period in the control, or choose Custom range… and fill in From and To. All tiles update together. Reset filters takes you back to the dashboard's own starting view. To compare with "last month", choose a period that covers that month and check that the figure matches the answer you got in Ask. When it does not, the period is almost always the reason.
Pin the value to Home (everyone)
Hover over the tile Highest quarter-hour and select the pin on it (Pin to Home). A small box opens. Tick Keep the current filters if the value should stay filtered the way it is now, then choose Pin. The value now sits under Pinned on your Home, and Cortex asks for it again every time you open Home, with your own access. You can pin up to 12 values per workspace; Manage on Home lets you reorder or remove them.
Details: Pin a value, pin a dashboard, subscribe.
Subscribe to an alert (everyone)
Select the bell on the dashboard (Subscribe) and choose Alert. Under KPI pick Peak against contract, under Tell me when it is choose above, fill in Value 100 and under Where choose In the Hub (bell). Choose Subscribe. Cortex says "Subscribed. You can change it under Subscriptions."
When a dashboard shows data limited to certain people, the box asks you to Give permission first, so Cortex may read that data as you while you are away. The permission ends after 90 days.
See the alert in the bell (everyone)
When the rule becomes true, a line labelled Alert appears in the notification bell at the top, with a dot on the bell. Select the line to land on the live dashboard. The line never contains the figure itself: the dashboard draws it with your own access. Choose Mark all as read when you have seen it.
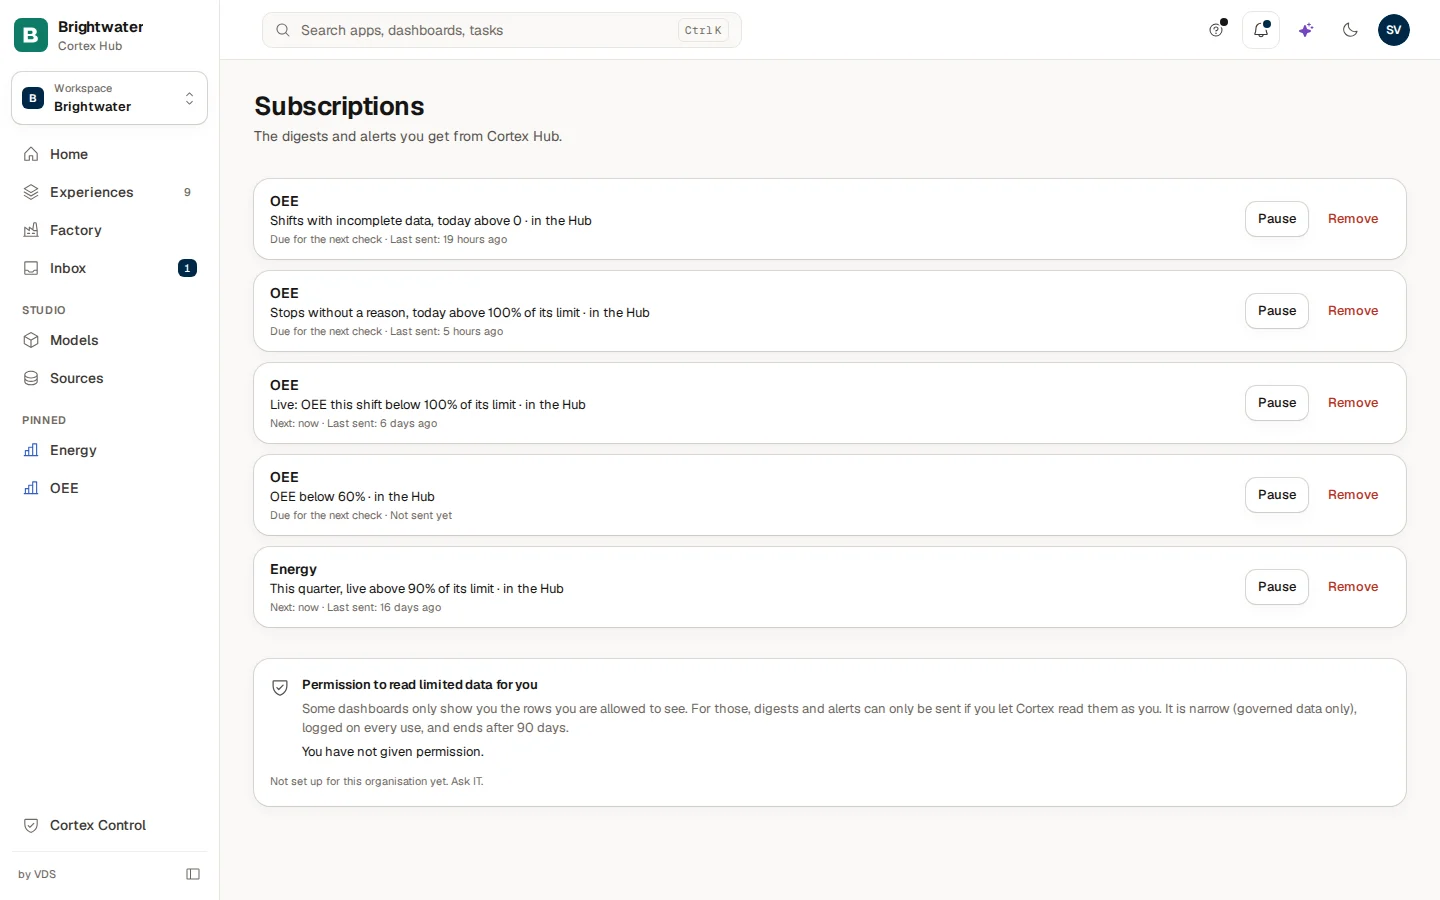
To pause or stop the alert later, open Subscriptions from your account menu, or choose Manage subscriptions in the bell.
Details: The notification bell and Subscriptions.