Build a dashboard
Check the figures in the model, build a dashboard with the dashboard chat, arrange the tiles and the phone layout, publish it and choose who can open it.
Brightwater Foods holds a weekly delivery meeting. Sam de Vries, a builder, makes the dashboard for it: orders delivered on time, open orders and the biggest delays, with last year next to it. This guide takes you from the figures in the model to a published dashboard that colleagues find under Experiences.
You end up with a published dashboard, a phone layout, a clear list of who can open it, and figures that carry a certified badge where it matters.
Builder: pick or add the figure in the model and certify it.
Builder: New dashboard, then describe it in the chat.
Builder: keep or undo, add and move tiles, phone layout.
Builder: check, review, publish, choose who can open it.
Everyone with access: opens it in Experiences.
Before you start
Who can do this
Builders (people with a Studio seat). Whether you may create dashboards depends on the builder policy your IT administrator set. To change a model you must be one of its owners. Changing who can open a dashboard is limited to its owner and IT. Some dashboards need a second person's approval before they go live: your organisation decides, see Approvals. The data must already be connected: see Connect a new system.
The steps
Pick the model and check the figure (builder, in Studio)
Open Models in the Studio group of the left menu and open the model for your subject, for example Sales or Production. On the Figures tab look for the figure you need ("12 of 52 figures", with Search figures to find it). Read its Meaning and the column Right?: it tells you whether the nightly check still matches the source.
Details: Semantic models.
Add the figure when it is missing (builder, model owner)
Write the figure in your own words in the box "Which figure should this model know?" and choose Describe this figure, or choose New figure and fill in the form: the table it is Calculated on, a Technical name and the Formula. A live Preview shows the result as you type. Set Good when to Higher is better for "delivered on time", so dashboards colour a rise green. Choose Save figure.
Details: Figures and certification.
Certify it, add a check and publish the model (builder, model owner)
Open the figure and find Certify this figure. Choose Run the reference check: Cortex compares the model's answer with an independent total from the source. When the result is Matches, choose Certify. On the Checks tab, Add a check lets Cortex verify more every night, for example a rule the data must follow. Then choose Publish in the top bar, read Changes since the published version, write a note and choose Publish. Only after that do dashboards see the new figure. Publishing makes the version live at once for everything that uses the model.
Details: Model checks and Semantic models.
Create the dashboard (builder)
Open Experiences, choose New and then Dashboard under "Start from scratch". The dialog New dashboard opens. Give it a Name ("Delivery meeting"), say what it is for, and check the Workspace. In the Data field the company option, your company name followed by "(all company data)", is already chosen; "Parts of the company model" and "Other models" are the other choices. Without a company model, the default model is already chosen. With only one model there is no Data field. Choose Create and open.
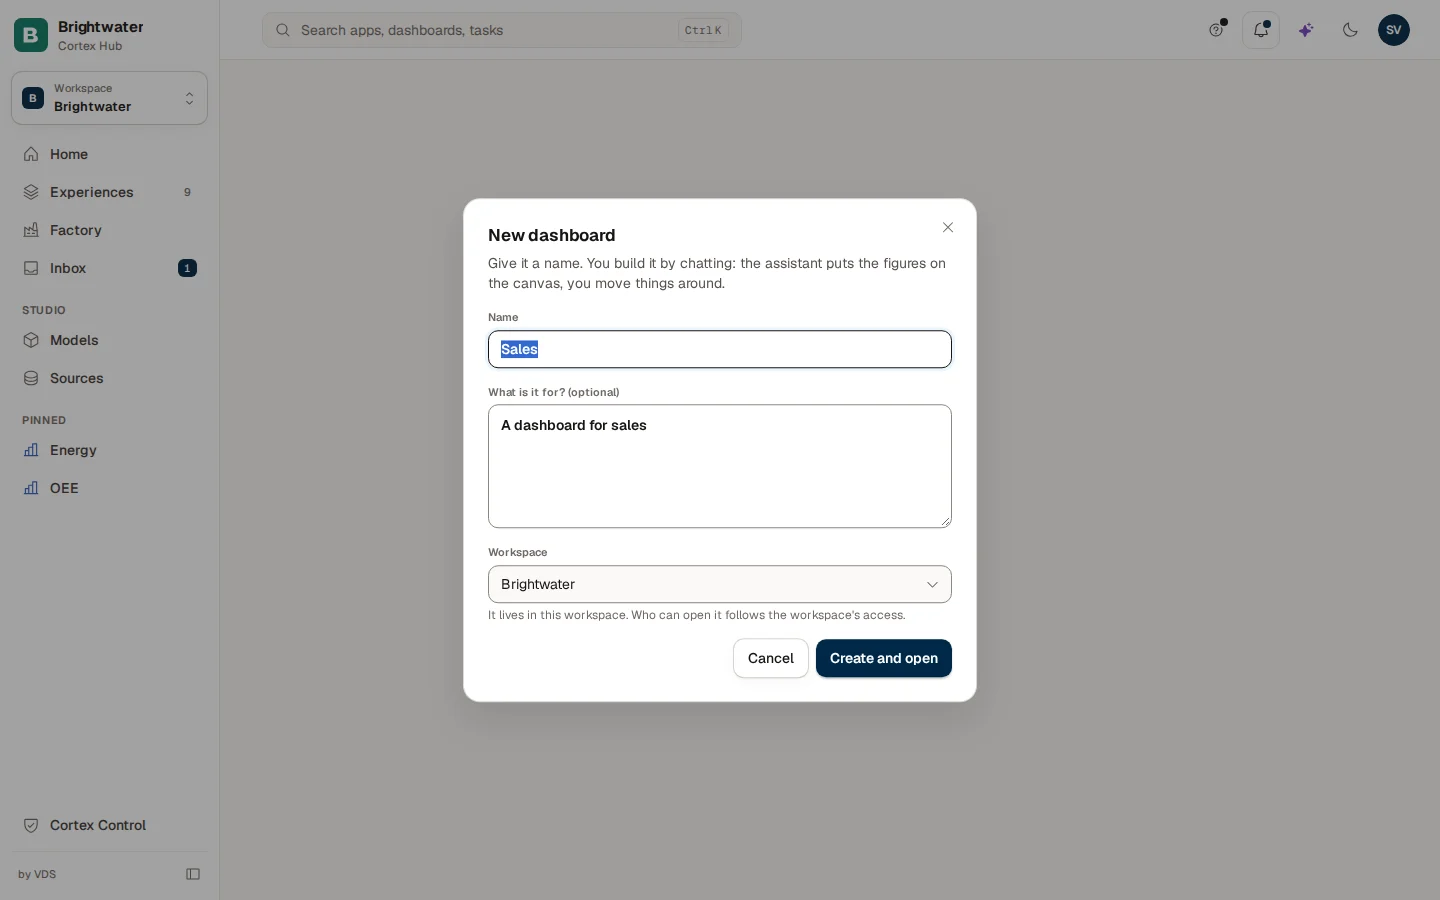
A faster way: press Ctrl+J, choose Build something and describe the dashboard in one sentence.
Details: Dashboards in Studio.
Describe it in the chat (builder)
The editor opens with the chat on the left and your dashboard on the right. Type "Show orders delivered on time per week, with last year next to it" or click one of the suggestions that come from your model's figures. Tiles appear one by one. After each turn the chat says what changed ("AI changed 2 tiles"): choose Keep to accept it or Undo to put the dashboard back. Click a tile and your next message is about that tile: "Make this a bar chart and show the top 10."
The assistant never types a number: every figure is computed from the model, for whoever looks.
Add and arrange tiles (builder)
Choose Add tile above the canvas, pick a type from the library (for example Number, Bar, Ranking or Table) and drag a field from the Data tab onto the tile that appears. Drag tiles to move them. Select a tile to change its settings, such as Compare with for last year. Use Add page to split the dashboard in two pages, here "This week" and "Delays". A dashboard holds at most 32 tiles.
Details: Tiles, filters and pages.
Set the phone layout (builder)
Choose View as… above the canvas and pick Phone (390 px). The Phone layout panel lists the tiles: use Move up and Move down to set the order, Hide on phones for tiles that do not fit and the height control for the rows. The desktop layout does not change. Choose Back to editing when you are done.
Check and publish (builder)
Open the ... menu and choose Check. Each tile shows Works, No data, Waiting for the model or Fails. Fix what is red with the chat ("Fix the problems the check found"). Then choose Publish. The dialog Review changes before publishing lists what changed; on a first publish it says "First publish: nothing is live yet." Confirm with Publish v1. The message says "Published as version 1." with Open in Hub. If your organisation requires a review, it says "Sent for review" and the dashboard goes live when a second person approves in Control.
Choose who can open it (builder, owner)
Open More and then Access ("Who can open this dashboard"). Set Visibility: Restricted (only people you grant access), Whole organisation, or Discoverable (people without access see the title and owner in Discover and can ask for access). Use Grant access for named people or groups. Only the owner or IT can change this.
People find it in Experiences (everyone with access)
In the Hub the dashboard is under Experiences, type Dashboards. Colleagues can pin it, subscribe to it and ask about a tile. Check it yourself with View as… or sign in as a colleague.
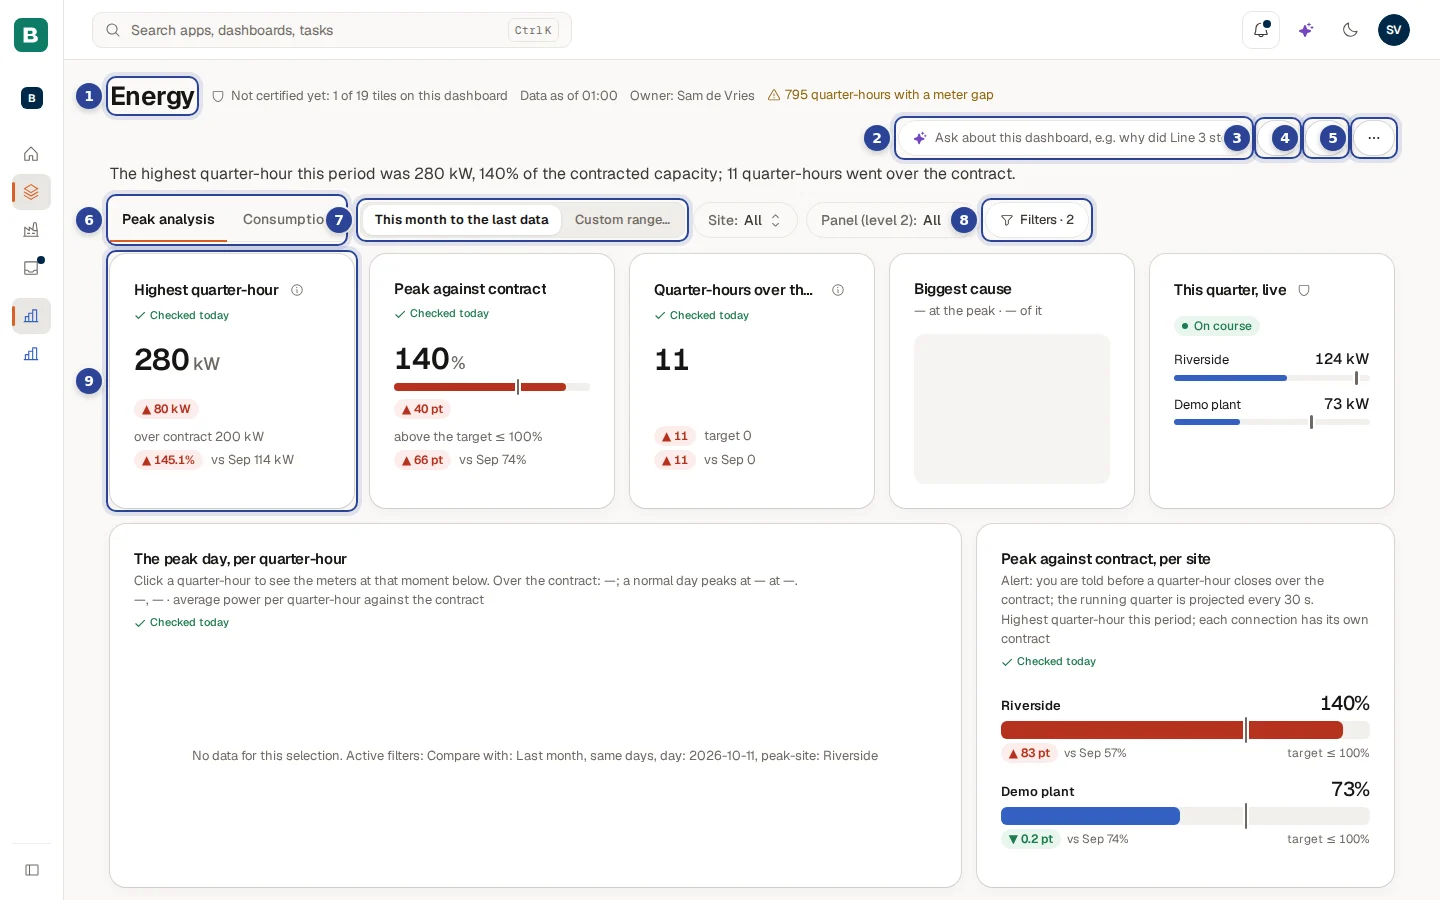
Details: Use a dashboard and Experiences.
If something does not work
What next
Answer and follow a figure
What your colleagues do with the dashboard: ask, pin, subscribe.
Tiles, filters and pages
Every tile type, its settings and the dashboard filters.
Import from Power BI
Bring an existing report over instead of starting empty.
Certified figures
What the badge means and when it goes away.
Request an app
From a request in the Hub to a published app: IT approves, a builder plans and builds, and the requester opens it and gives feedback.
Automate an approval
Build an order-approval workflow, test it, publish it, let a manager approve in the Inbox and follow the run, with IT keeping an eye on it.