Tiles, filters and pages
Add and change tiles by hand, build pivots and drill paths, set periods and filters, use pages, a summary sentence and a phone layout.
A dashboard is made of tiles. A tile shows one thing: a number, a chart, a table, a sentence. You can ask the assistant for any change in the chat, or do it by hand. Both end up in the same place, and every change you make by hand is one step you can undo with Ctrl+Z.
This page is about doing it by hand: the tile library, the data tab, the settings of a tile, pivots and drill paths, and the settings of the whole dashboard (filters, pages, summary, density and the phone layout). Creating, checking and publishing the dashboard is in Dashboards.
Who can do this
Builders (people with a Studio seat) and admins, in the editor of a dashboard. While the assistant is working your edits wait; if you may not edit the dashboard, the controls are off and say why.
From the library: a number, a chart, a table.
Figures and dimensions from your model, by dragging or from a menu.
A field that cannot be combined with the others is refused, with the reason in plain words.
Title, period, filters, sort, colour. The preview updates as you go.
The tile library
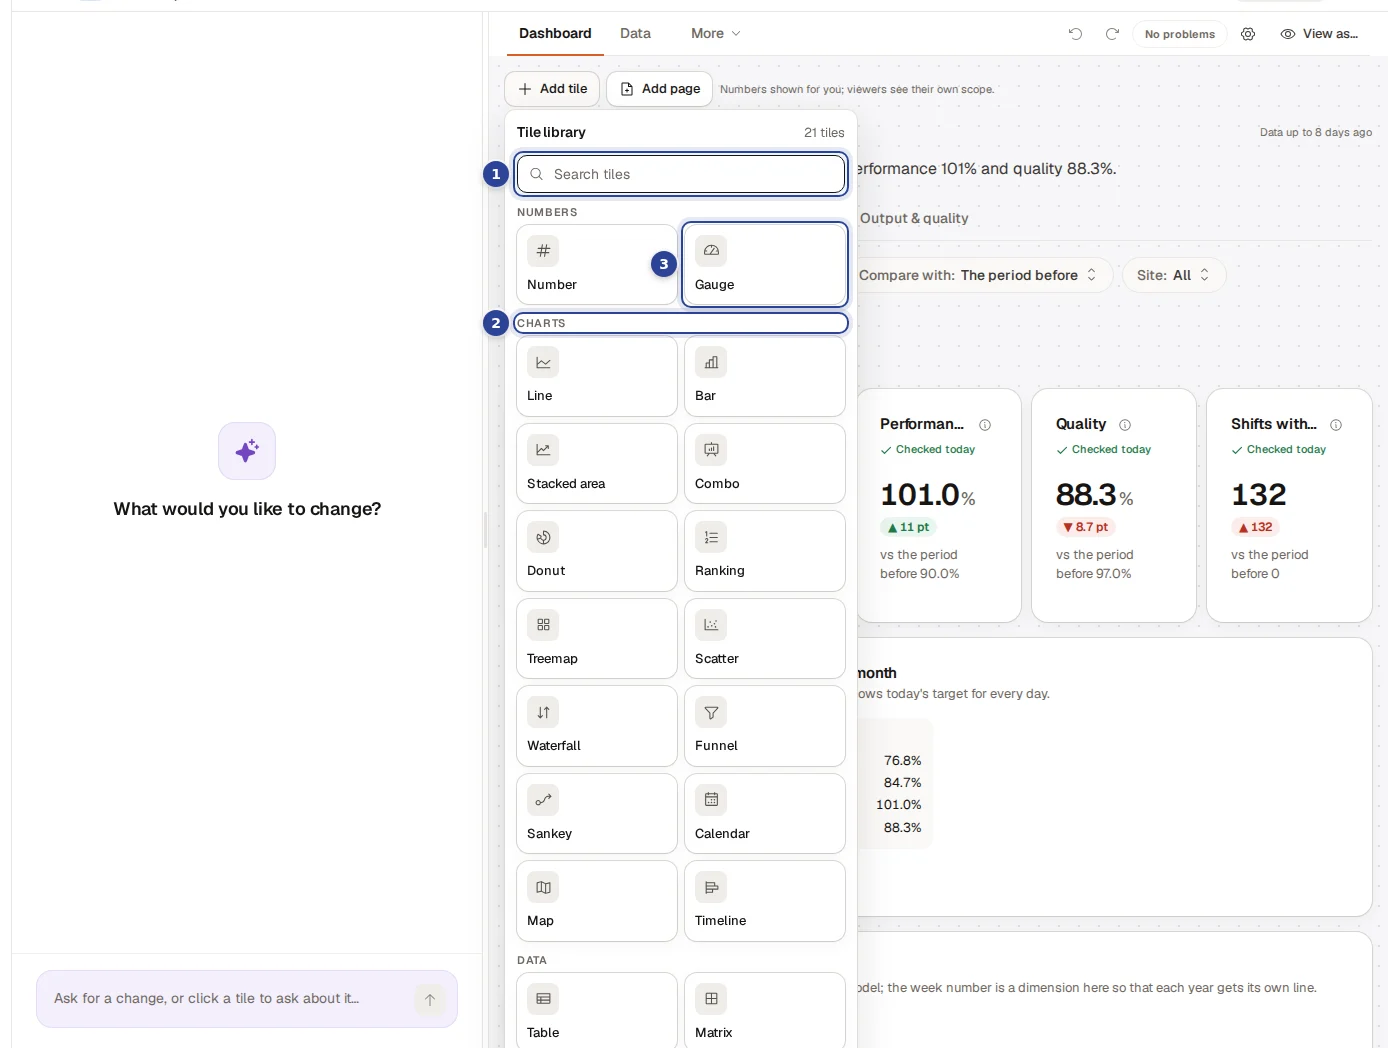
- Search tiles. Type a few letters to narrow the list. "No tile type matches." appears when nothing fits.
- The groups. Numbers, Charts, Data and Content. The title shows how many types there are.
- A tile type. Click one to arm it, or drag it onto the canvas. A ghost tile appears and waits for its fields. Text needs no fields and is added at once.
The tile types
| Group | Type | What it shows | What it needs |
|---|---|---|---|
| Numbers | Number | One headline figure, optionally compared with the prior year. | 1 figure. |
| Numbers | Gauge | One figure against its target. | 1 figure. |
| Charts | Line | A figure over time. | 1 figure and a date. |
| Charts | Bar | A figure per category. | 1 figure and 1 category. |
| Charts | Stacked area | A figure over time, split by a category. | A figure and a date dimension with a grain, for example invoice date by month. The figure must add up across the split. |
| Charts | Combo | Two figures on one chart: bars and a line. | 2 figures. |
| Charts | Donut | Shares of a whole. | A figure that adds up across categories (not a ratio or a snapshot). |
| Charts | Ranking | Categories ordered by a figure. | 1 figure and 1 category. |
| Data | Table | Rows with one or more figures. | 1 or more fields. |
| Data | Matrix | A figure with one dimension in the rows and one in the columns. | 1 figure and 2 dimensions. |
| Data | Pivot | An expandable breakdown, level by level. | At least 2 category levels, and figures (see Pivots). |
| Content | Narrative | A sentence whose figures are filled in live. | None; you write the sentence. |
| Content | Text | Fixed text, such as a note or a heading. | None. |
A page holds at most 40 tiles and a dashboard at most 200 ("A page holds at most 40 tiles and a dashboard at most 200. Add a page or remove a tile."); add a page when one is full. Some tiles come from a connector pack, for example a link to an app for the asset a board is filtered to; you cannot add those by hand.
Add a tile by hand
Choose a type
Choose Add tile above the canvas and pick a type from the library. A ghost tile appears where the tile will land, with a text such as "Add fields for a Bar tile here. Starts at … columns × … rows. Needs 1 figure and 1 category or date. Drag them here from the Fields tab, or use a field's menu."
Add fields
Open the Data tab (it opens by itself when the type needs fields) and drag a field onto the ghost tile or the canvas, or open the "..." menu on a field and choose Add to selected tile or New tile. Select several fields and choose "Add n selected as a new tile" to make a tile from them at once. A figure on its own becomes a number; a figure with a date becomes a line chart. The ghost tile tells you what is still missing: "Now add a figure", "Now add a date to plot it along" or "Now add a category to group by".
Fine-tune
Click the tile. Its settings open at the right edge (see Settings of a tile).
Without any tile, the canvas says "Drop a field to add your first tile". There are two shortcuts for an extra field on an existing tile: Add field in the tile's settings opens the same field list over the canvas, and dragging a field onto a tile adds it to that tile.
The Data tab
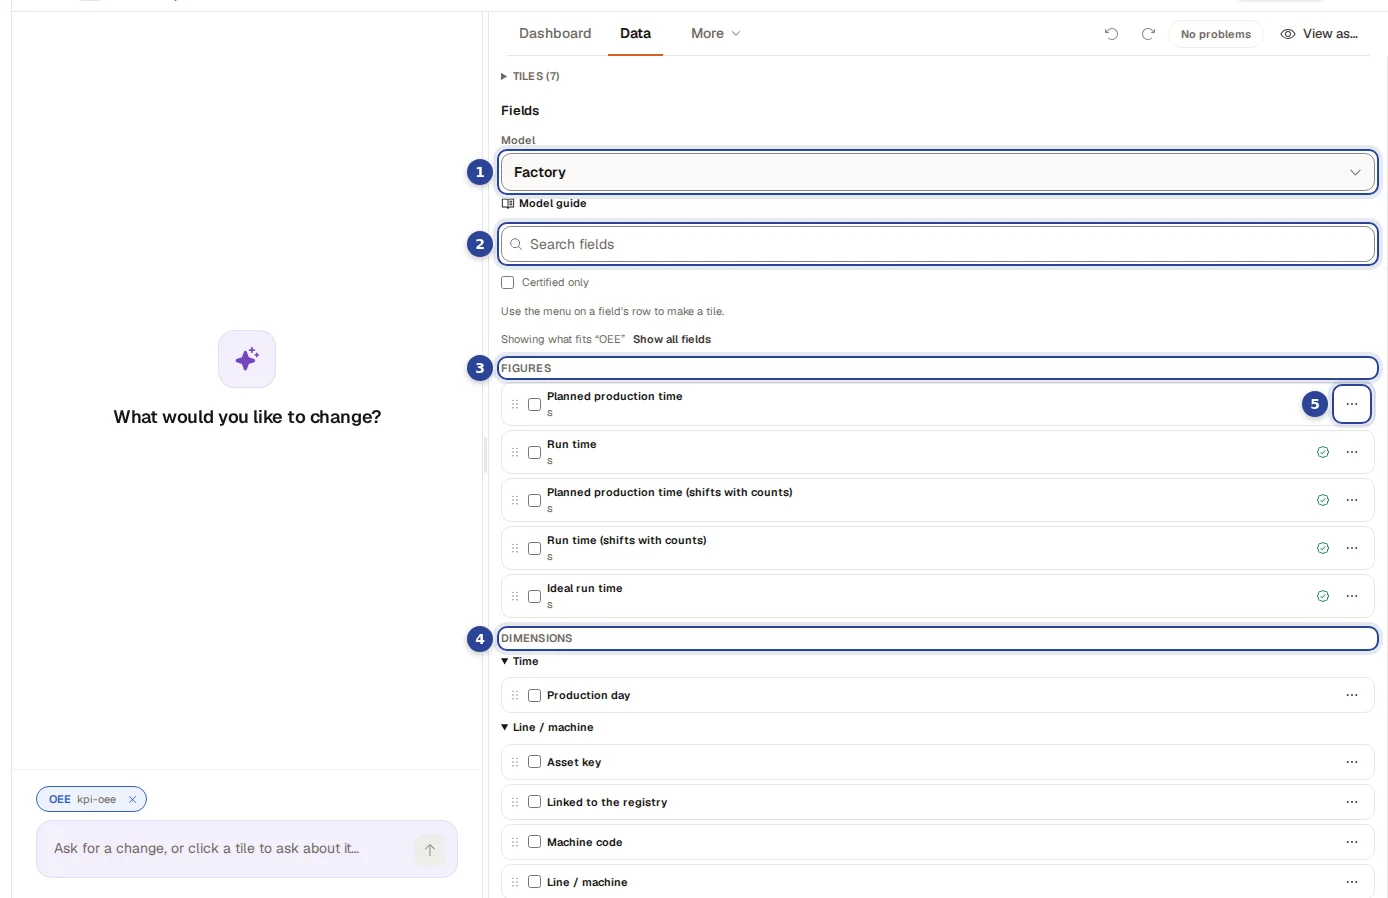
- Model. The model the dashboard reads. The default model is marked "(default)".
- Search fields. Narrows both lists.
- Figures. The numbers you can show, such as revenue or margin. A seal marks a figure as Certified and a warning sign as Not certified; the box Certified only hides the others.
- Dimensions. What you can group or filter by, such as customer, product group or date.
- The row menu. Add to selected tile and New tile.
When you have selected a tile, the list shows only what fits it ("Showing what fits "Revenue per month""). Fields that cannot be combined with it are collected under "Other data (n): can't be combined with what you picked", and Show all fields lists everything. When a figure you need does not exist yet, choose Request a figure and describe in business words what it should mean (at most 240 characters). The model owners turn it into a governed figure. See Semantic models.
When a field is refused
Cortex only lets you combine what gives a right answer. A refusal says why, in plain words:
| You see | What it means |
|---|---|
| "A number shows one figure. Switch to a table to show several." | A Number tile holds a single figure. |
| "A chart takes either several figures or a split by one dimension, not both." | Choose one: more figures, or a split. |
| "This chart already uses both of its dimensions (axis and split)." | A chart has an axis and at most one split. |
| "This date belongs to other data than this tile shows. Use one of the tile's own dates." | The figure and the date come from different data. |
| "This figure has another unit than the one already on the chart ... Use a Combo (two axes) or give it a tile of its own." | Two units would flatten one of them. |
| "This figure cannot be stacked: it is a ratio or does not add up across the split." | Use a bar or a line instead. |
| "This is a stock figure (a snapshot): it cannot be added up over time ..." | Use its own date and a coarser period. |
| "This data has more than one date (for example created and closed). Group the tile by the date you mean, then set the period." | Name the date first. |
A tile that already has problems lists them at the top of its settings under "Problems with this tile", as Error or Warning.
Settings of a tile
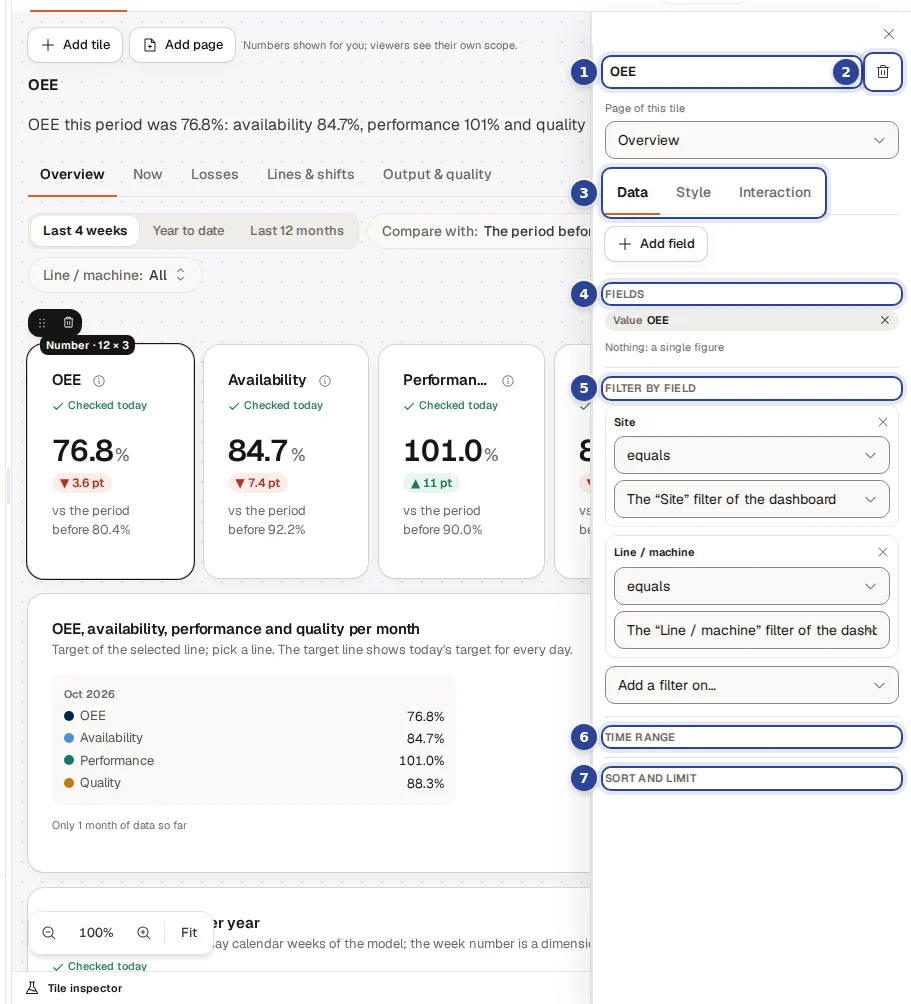
- The title. Edit it where it is shown; press Enter to keep it.
- Remove tile (the bin). One undoable step, no confirmation.
- The tabs. Data, Style and Interaction.
- Fields. The figures and dimensions of the tile, in the order you want. Each has its role (Value, X axis, Series, Rows, Columns, Target, Level), a remove button and, for a date, the Time grain: Day, Month, Quarter or Year.
- Filter by field. Add a filter on a field with an operator, and a value.
- Time range. All time, Month to date, Quarter to date, Year to date, Last 12 months or Last year, or the period filter of the dashboard.
- Sort and limit. Sort by a field, Ascending or Descending; Only the top a number of rows; or a Row limit.
In a dashboard with more than one page, Page of this tile at the top moves the tile to another page.
Filters on a tile
A tile filter has an operator: equals, does not equal, is one of, is none of, is greater than, is at least, is less than, is at most, is between, is empty or is not empty. The value is A fixed value or comes from a filter of the dashboard ("The "Period" filter of the dashboard"): then viewers steer it themselves. For a field with a known list you pick values; otherwise you type them, separated by commas.
The tabs Style and Interaction
| Tab | Section | What you set |
|---|---|---|
| Style | Visual | Switch the tile to another type that its fields can make. The other types are listed in one line with the reason, for example "3 more need other fields: Matrix, Combo, Donut". |
| Style | Title and note | The title and a note under it. Each has a toggle "Add Dutch" or "Add English" for the other language; left empty, it falls back to the language you are in. |
| Style | Number | Compare with: Nothing, Prior year, % change or Prior year, difference. A rise is: Good, Bad or Neutral (marks the change as good or bad). Target. |
| Style | Table | Rows per page and Show a total row. |
| Style | Colour | A colour from the dashboard palette, or Automatic. The first series takes it; the others follow. |
| Style | Chart height | Make this chart taller keeps the height you give it on the grid; off, a chart is a standard height of about 240 pixels. |
| Interaction | Export data | A CSV of the tile, with the numbers you are allowed to see, up to the row limit of the engine. The export is recorded. |
| Interaction | Open in Excel | Shares the tile as a live Excel feed that shows each person only what they may see. |
| Interaction | Drill path | See Drill paths. |
A text tile only has its title and text. A narrative tile has the section below.
Narrative
A narrative tile is one sentence, written once. "Every figure is a placeholder that is filled from the live data for each viewer; never type a number." The tile lists the Placeholders you can use, and @total and @last give the total and the last row. Draft with AI writes a first wording: the model sees the names of the fields, never a value, and you review the wording before Use this wording.
Pivots
A pivot is an expandable breakdown: each level asks for its own figures, so subtotals and ratios are always right. It needs at least two categories as levels (for example customer group, then customer), at most five levels and four values, and a date cannot be a level (use a line or bar for time, and put the date in the period filter). Under Pivot set Open on first view ("Only the first level" or a number of levels) and Rows per node; a node shows that many rows, then says how many more there are.
Drill paths
A drill path lets a click on a value continue with the next field, filtered to what was clicked. Select a bar, donut or ranking tile, open Interaction and choose Add a level under Drill path. A path has at most 8 levels and the fields can come from different tables. A tile that drills through a hierarchy cannot also have a drill path, and a field that is already on the chart cannot be in the path.
Settings of the whole dashboard
Click the background of the canvas, or choose the gear Dashboard settings, to see the properties of the dashboard itself.
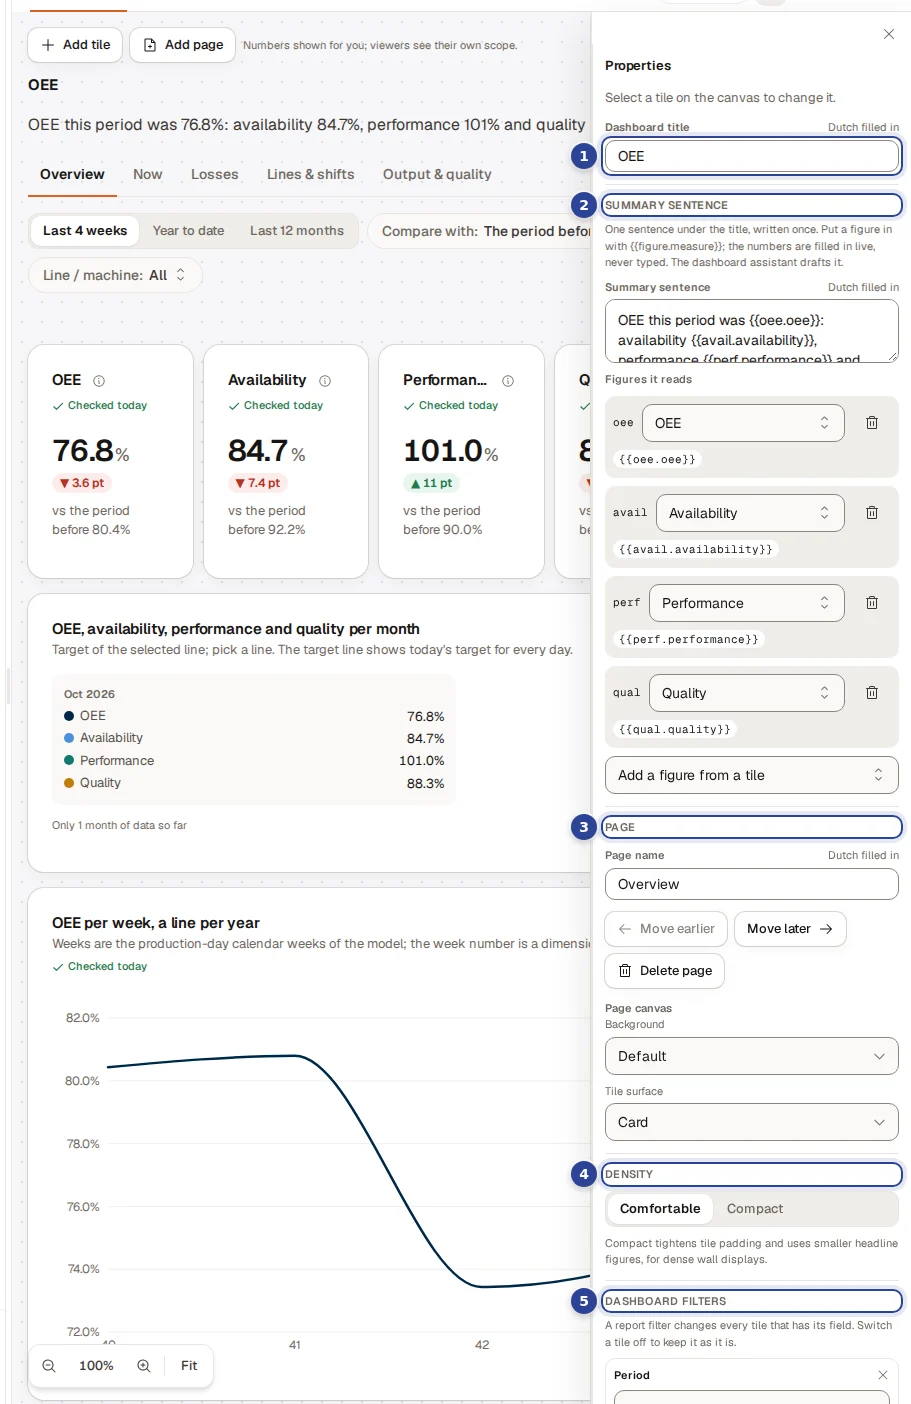
- Dashboard title. In the language you are in; the other language is behind the toggle.
- Summary sentence. One sentence under the title, written once. Put a figure in with
{{figure.measure}}; the numbers are filled in live, never typed. The dashboard assistant can draft it. - Pages. Add page (at most 12), rename, Move earlier, Move later, Delete page (it asks "Delete the page and its n tiles"). Page canvas sets the background: Default, App canvas, Light, Recessed or an Image (PNG, JPEG or WebP up to 12 MB, made smaller to fit 256 KB), a Scrim (Light, Medium, Strong) that keeps tiles readable, and the Tile surface (Card or Flat). A note says whether tiles stay readable on any photo.
- Density. Comfortable or Compact ("Compact tightens tile padding and uses smaller headline figures, for dense wall displays.").
- Dashboard filters. Add a filter on… and pick a field. A date field gives a Date range. See below.
Dashboard filters
A dashboard filter gives viewers a picker, for example a period. It changes every tile that has its field.
- For each filter choose which tiles it Applies to ("Applies to 3 of 5 tiles"). A tile that has its own filter on that field is marked "Has its own filter".
- Give a Starting value if you like. Viewers can change it; "Empty = no restriction." The Operator is stored on the tiles, so switch a tile on first.
- A dashboard has at most 12 filters, and one per field. With pages, a filter can be Shown on all pages or only some.
Phone layout
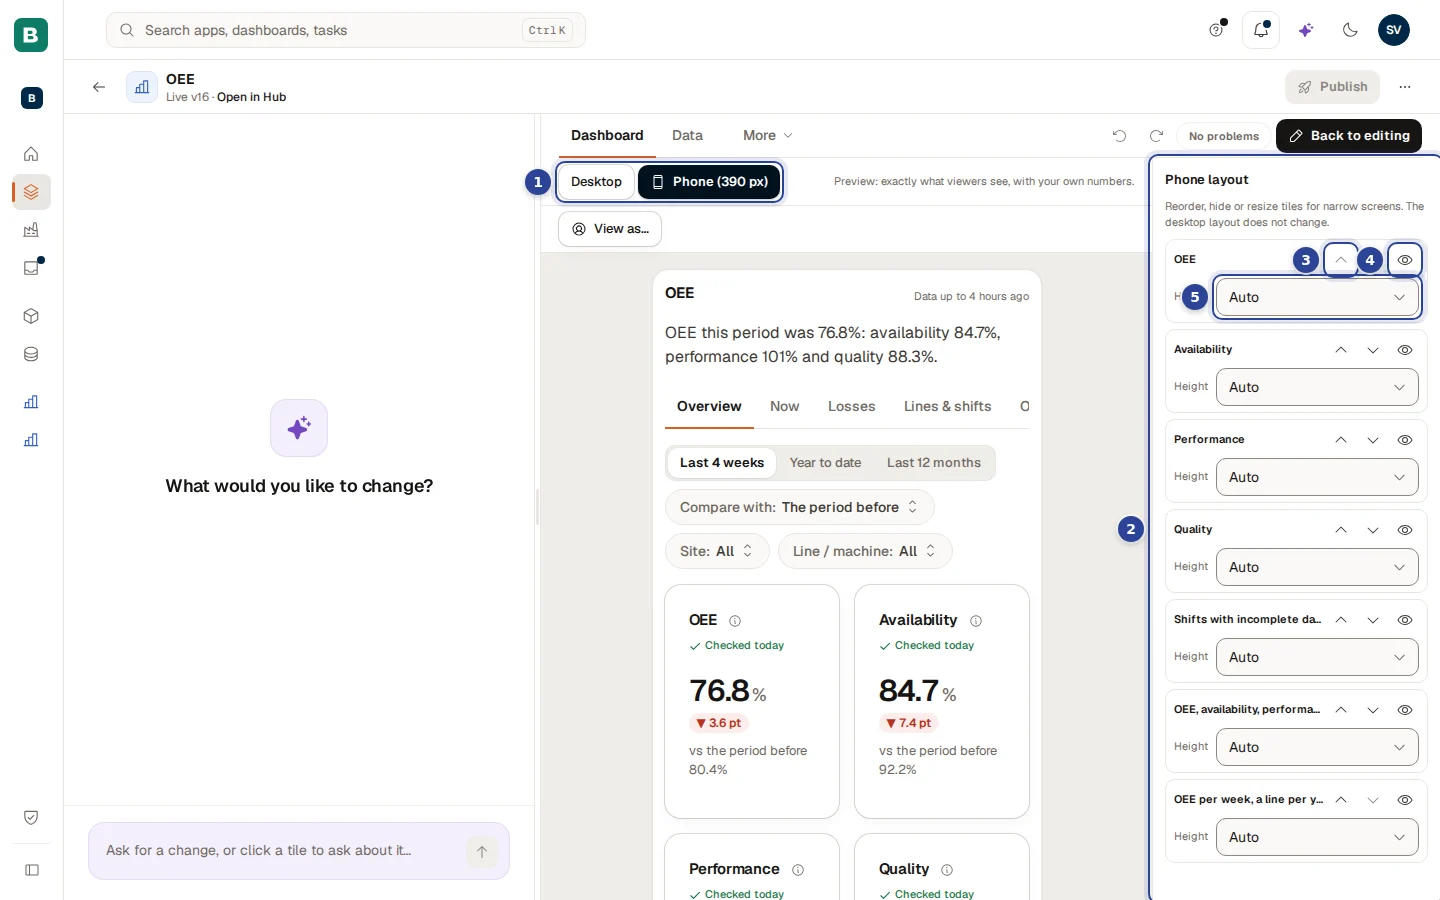
Choose View as…, then Phone (390 px). Beside the preview the Phone layout panel lists the tiles. "Reorder, hide or resize tiles for narrow screens. The desktop layout does not change."
- The width buttons. Desktop or Phone (390 px).
- The panel. One row per tile.
- Move up and Move down. The order on a phone.
- Hide on phones. A hidden tile is marked "hidden"; Show on phones brings it back.
- Height. Auto or a number of rows.
New tiles and options
Comes with the next release
The tiles and options in this section come with the next release. They are not in the tile library yet, the settings of a tile have no controls for the new options yet, and the dashboard assistant does not offer any of it yet. They first appear on dashboards that already carry them, for example from a Power BI import (see Import from Power BI) or from a pack. Choosing them in the library, setting the options in the tile settings and asking the assistant for them follow in a later release. Until then, if you try to switch a tile to one of these types, the editor says the builder cannot make that visual from these fields yet; for a timeline it says the tile comes with a pack or an import.
Two rules hold for every one of them. Every number comes from your model, so it is the same figure you see everywhere else; a tile never adds up or estimates a value itself. And every chart has a View as table button, a phone layout and light and dark colours.
New tile types
| Tile | What it shows | What to know |
|---|---|---|
| Timeline, Gantt | One row per order or run, with the planned bar (dashed) and the actual bar, a line for now, and late work in the negative colour with a symbol. | Needs a list of rows with a start and an end time. For now the timeline shows the rows the query returns; it does not yet cut them to the dashboard period. On a phone the chart scrolls sideways, because a list would hide which bars overlap. |
| Timeline, machine states | One lane per machine, with coloured stretches for running, planned stop and unplanned stop. | Each state has its own symbol and word as well as a colour. Time spent running is the time of the runs minus the stops, so a machine without a run is shown as "no run", not as running. If the stops list is cut off, the chart is not drawn and you get the table with a notice. |
| Treemap | One figure per category as rectangles whose area is the value. | The figure must add up across categories. At most 30 rectangles; the rest is one rectangle called "Other". On a phone it becomes a ranking list. |
| Scatter / bubble | One point per group, with two figures for the position and, optionally, a third for the bubble size and a category for the colour. | At most 500 points and 6 colours. The query must have a limit. |
| Waterfall | A start figure, the steps that raise or lower it, and the end figure. | The start, the steps and the end are each a figure of your model. If start plus steps does not match the end figure, the tile says it does not add up and draws nothing, instead of drawing a chart that is wrong. A step up is good, a step down is bad. |
| Waterfall by category | One figure per category as a running total: every member raises or lowers the level, the categories beyond the top are one "Other" bar and the Total closes it. | Pick one category and one figure that adds up (not a ratio or a distinct count); the top of the category list is required (30 at most). The levels are the engine's running figures, never worked out in the browser. A category with no figure shows "no value" and the level carries on; a figure that is withheld for the viewer shows the table instead of bars. The table view lists category, kind, figure and running total. A date category is not offered yet. |
| Funnel | Stages that narrow, from top to bottom, in the order of your model. | A step percentage is shown only when you have chosen a figure for it in the model; Cortex never works one out for you. |
| Sankey | The flow of one figure between the values of two categories, for example loss minutes from cause to line. | The figure must add up. At most 200 flows and 30 values per side. The totals at the nodes are the model's own totals. On a phone it becomes a list of flows. |
| Calendar | One square per day in week columns (Monday first), tinted by a figure. | One date at day level and one figure, at most 366 days. A day without data stays empty, it is not shown as zero. |
| Map | A filled map of Dutch provinces, municipalities or 2-digit postcode areas, or of European countries, tinted by a figure. | The maps come with the product and need no internet connection. The tile names a layer and the field that holds the region code; when the model gives that field a Map role (see How do I tell the model that a field holds map codes?) the layer follows from it, and the dashboard assistant offers a map only on such a field. A region without data is shown hatched ("no data"), never as zero. A code that is not on the map, for example a municipality that no longer exists in the chosen year, is listed under the map and in the table. The source of the map is shown on the tile. |
New options on existing tiles
| Option | Where | What it does |
|---|---|---|
| Colour scale | Table and matrix | Tints the cells of a figure in five steps from light to dark blue, or, around a centre value, five warm steps below and five blue steps above. The number always stays in the cell. A cell that already has a status colour keeps that colour. |
| Data bars | Table | A thin bar under the number in a figure column. |
| Trend per row | Table | A small line per row, one point per week, month or quarter. It needs a column that names each row, shows at most 25 rows per page, and is not available on a table that shows only the top rows or has a row limit. |
| Show as 100 % | Bar and area chart split by a category | Every bar (or date) becomes one whole and each segment its share of it. The shares come from the engine, not from the browser, and the tooltip shows the share and the figure, for example "Jam 23 % (60 min)". The figure must add up across the split, the chart needs a category to split by, and it is not available on a chart that shows only the top rows (the shares are taken before the cut, so the segments shown would not add up to 100 %). |
| Pareto | Bar chart | One figure by one category, the largest first, with the running share as a line on an axis from 0 to 100 % on the right and a dotted line at 80 %. It shows which few causes carry most of the loss. It needs a top (at most 30 categories), a figure that adds up and a category that is not a date, and it cannot be combined with a split, a second axis, a target or a horizontal bar. The categories beyond the top are not drawn, so the line then ends below 100 %. |
| Right-hand axis | Line and bar chart | Puts up to two figures of another unit, for example a percentage next to a number of units, on their own axis on the right. On a bar chart those figures are drawn as lines. |
| Extra figures in the tooltip | Line, bar, area and combo chart | Up to four more figures that appear when you hover, without being drawn. |
| Figures in the title | Any tile | A title can contain a figure of the tile, for example "Revenue" followed by this month's value. When there is no value, a dash is shown. |
Power BI imports
A 100 % stacked bar or area chart in a report becomes a chart shown as 100 % when it splits one figure by a category; with several figures or no split it stays stacked on the real values and the report says so. An import now carries more of what the report attached to a figure. Colour rules and icon rules become the status colours of Cortex (red negative, amber warning, green positive; the colours of the report itself are not carried), colour gradients become a colour scale, data bars become data bars, a second axis and tooltip fields are carried, and treemaps, funnels, scatter charts and waterfalls become tiles. The import report says what was carried and what changed. When a rule with four or five icons had to be folded onto three states, the visual is marked With a caveat and the report asks you to check the direction. Maps and a waterfall by category are still not carried: the report lists them with the reason. A 100% stacked chart comes across as an ordinary stacked chart, marked With a caveat.
Example: the OEE board of the packing line
Sam de Vries at Brightwater Foods builds a board for the packing line.
A headline number
Sam chooses Add tile > Number, drags the figure OEE onto the ghost tile and sets Compare with to Prior year, % change and A rise is to Good.
A trend and a ranking
A Line tile with OEE and the date by Month, and a Ranking with OEE per line. Sam sets Only the top to 5 on the ranking.
A period for everyone
In the dashboard settings Sam adds a filter on the date field. It becomes a Date range that Applies to all tiles, with Last 12 months as the starting value.
The phone
In View as… > Phone (390 px) Sam moves the headline number to the top and hides the table, then publishes. See Dashboards.
Questions and problems
Dashboards
Create a dashboard with the AI assistant, check it, publish it, restore an earlier version, preview it as someone else and choose who can open it.
Semantic models
Create a model, add tables and relationships, explore and secure it, check its health, publish it and bring an earlier version back. Everything the model studio does, tab by tab.