Overview, attention list and health
Read the Overview page, work through what needs attention and check the health of every app environment.
Overview is the first page you see in Cortex Control. It answers two questions in one glance: is everything running, and is there something an admin has to do? It shows how your apps are doing, what is waiting for a decision, what AI building has cost this month, and one list of things that need your attention.
The page has three tabs: Overview, Health and, for admins, Usage & cost. The sections below follow the page from top to bottom, then the Health tab.
Who can do this
Admins of Cortex Control. The page is for the people who run Cortex in your organisation, not for end users.
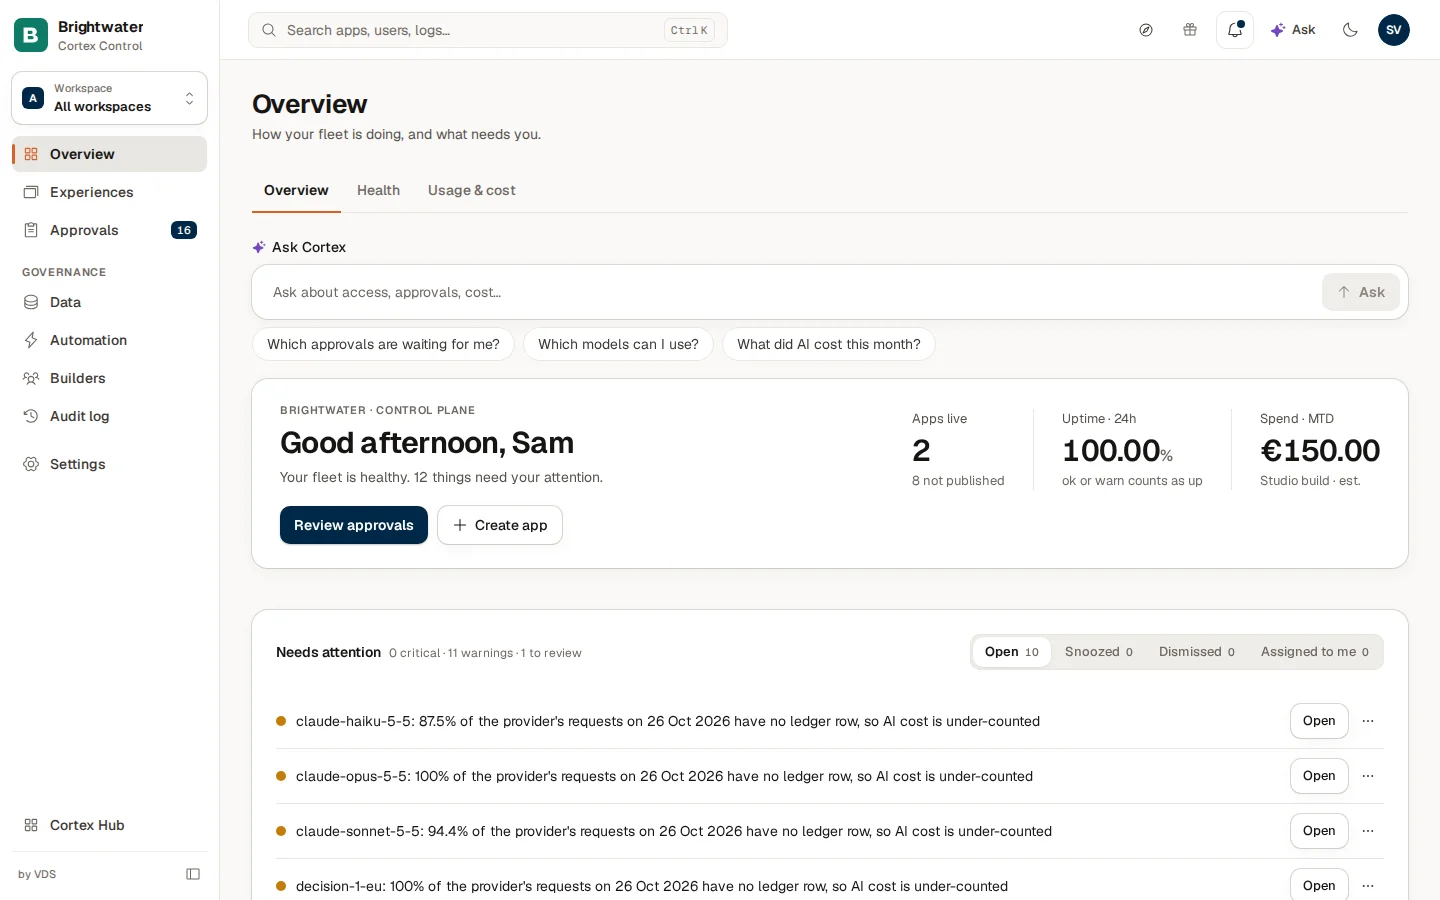
The count next to Overview in the left menu is the number of apps that are down right now. The count next to Approvals is the number of requests that wait for a person.
Ask Cortex from Control

- The question field ("Ask about access, approvals, cost…"). Type a question in your own words and press Enter.
- Ask. Sends the question. It stays grey until you have typed something ("Type your question to ask it.").
- Suggestions. Click one to ask it at once: Which approvals are waiting for me?, Which models can I use? and, for admins, What did AI cost this month?
The greeting and the three figures

The small line above the greeting names your organisation ("BRIGHTWATER · CONTROL PLANE"). Under "Good evening, Sam" one sentence sums up the fleet: "Your fleet is healthy.", "Your fleet has 1 active incident." or "1 environment is degraded — check Health." It ends with the number of things that need your attention.
- Review approvals. Opens the Approvals page.
- Create app. Starts the form for a new app (see Apps).
- Apps live. How many apps run. The line under it says how many are still being set up ("3 provisioning"), have not been published ("8 not published"), or that all are provisioned.
- Uptime · 24h. The share of probes that found your environments up over the last 24 hours. The line under it reads "ok or warn counts as up": an environment with a warning still counts as up.
- Spend · MTD. What building in Studio has cost this calendar month. It reads "Studio build · est." while your rates are estimates. The detail is under Usage and cost.
Fleet health, approvals and people
Below the greeting the page has four more blocks.
| Block | What it shows | Where it leads |
|---|---|---|
| Needs attention | One list of what an admin should look at, sorted by severity (see below). | The place that fixes each item. |
| Fleet health | Every app with the state of its dev and production environment: "n of m environments healthy · polled every 60s", and "n incidents", "n degraded" or "all healthy". An app that is still being set up reads provisioning, an app that was never published reads Not published. | The Health tab and the app. |
| Approvals queue | How many requests are pending, the first three, "+n more awaiting review", and Review all approvals. It reads clear when nothing waits. When a list behind the count could not be loaded and nothing can be shown, it says "Not every request could be loaded, so we cannot tell whether any are waiting. Open Approvals to check." instead of clear. | Approvals. |
| Studio · build spend and People & access | This month's spend against the monthly budget ("of … budget", "n% used", or "no budget set"), tokens and calls, and the number of Administrators and App users. | Usage and cost and People. |
Work through the Needs attention list
Needs attention is the list an admin works from. Every row is one sentence plus a button that takes you to the place where you can fix it. The list is sorted by severity and counts them in the header: "0 critical · 9 warnings · 1 to review".
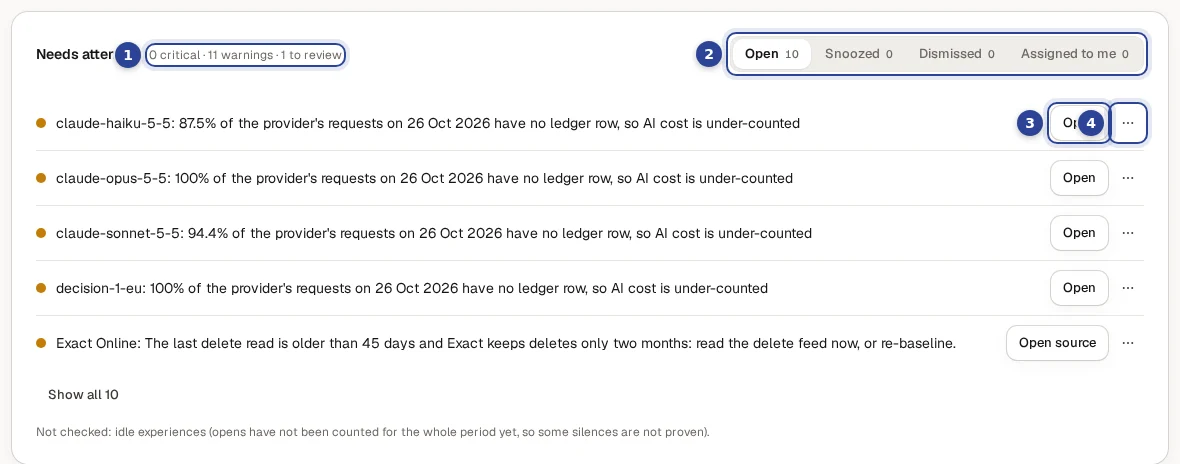
- The counts. How many items are critical, warnings, or only to review.
- Show. Switches the list between Open, Snoozed, Dismissed and Assigned to me. Each option shows how many items it holds.
- The button on a row. Takes you to where the item is fixed. Its label depends on the item: Open, Open data, Open approvals, Open licence, Open users or Open source.
- The row menu ("Actions for: …"). Lets you deal with an item without fixing it right now.
The list shows five rows first. Choose Show all … (with the number of rows) to see the rest and Show fewer to fold it again. If part of the list could not be read, a line under it says which part was not checked.
What the list warns about
| Area | Examples of a row |
|---|---|
| Licence | The licence expires in a number of days, or has expired. Button: Open licence. |
| Credentials | A credential of a connection expires soon, has expired, or could not be renewed. |
| Data | A dataset whose sync failed, is late or has never run, or whose source changed its columns. Buttons: Open data, Open source. |
| Approvals | Requests that have waited for days. Button: Open approvals. |
| AI cost | The monthly AI ceiling is close, reached or passed, or the provider reports requests that are missing from the cost ledger. |
| People | There is only one administrator, or a guest account holds a privileged role. Button: Open users. |
| Ownership and use | An app or dashboard has no owner, has an owner who was deactivated ("Sales dashboard: its owner Eva Jansen is deactivated"), has not been used for a long time, or opens slowly. |
Snooze, dismiss or assign an item
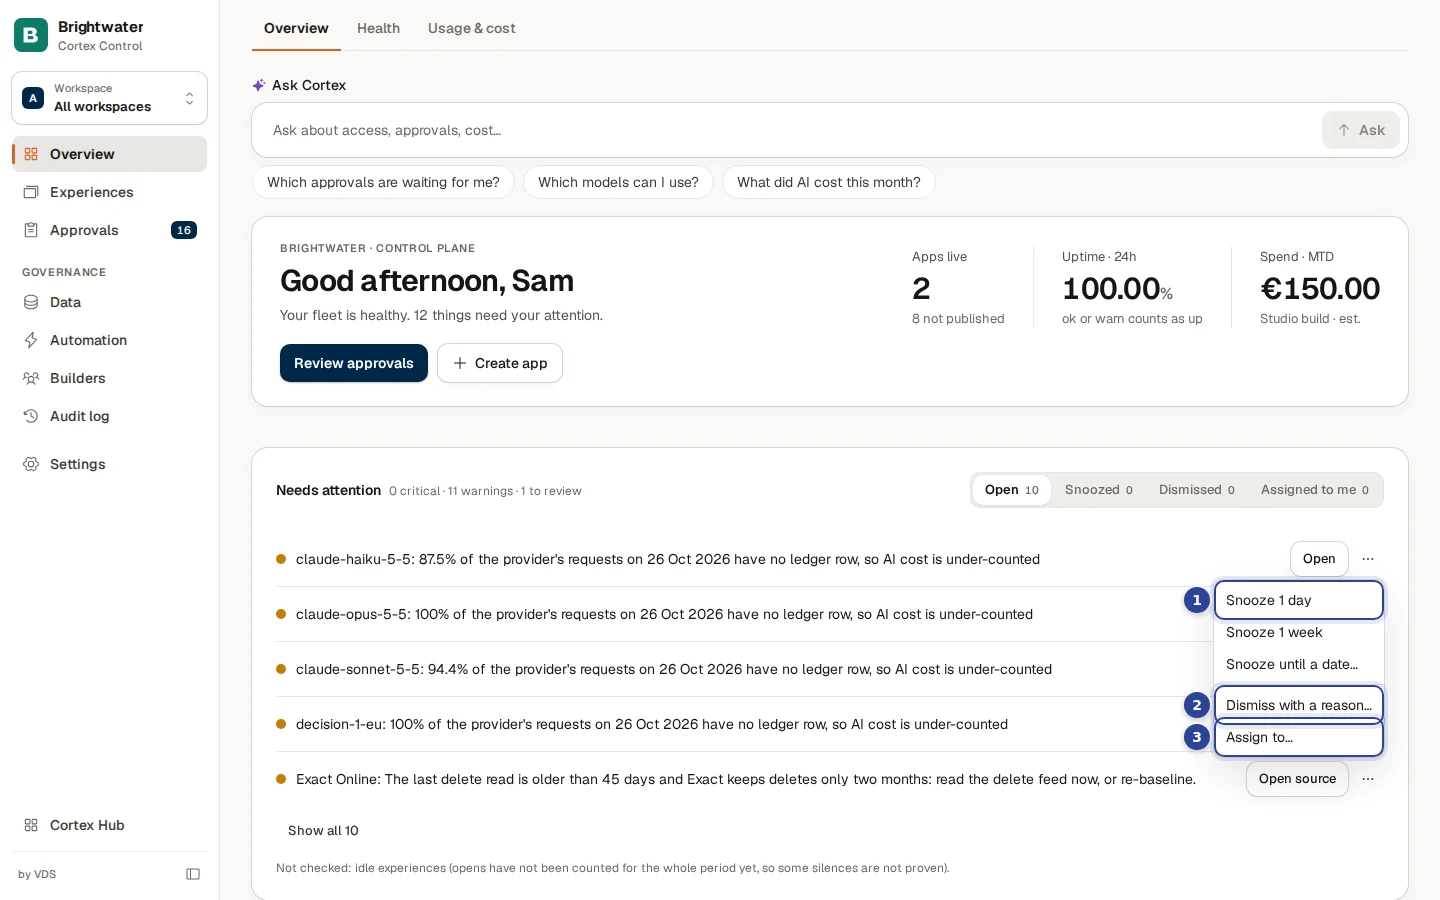
- Snooze 1 day. Hides the item from the open list for a day. Snooze 1 week does the same for a week.
- Dismiss with a reason… Hides the item until the situation changes.
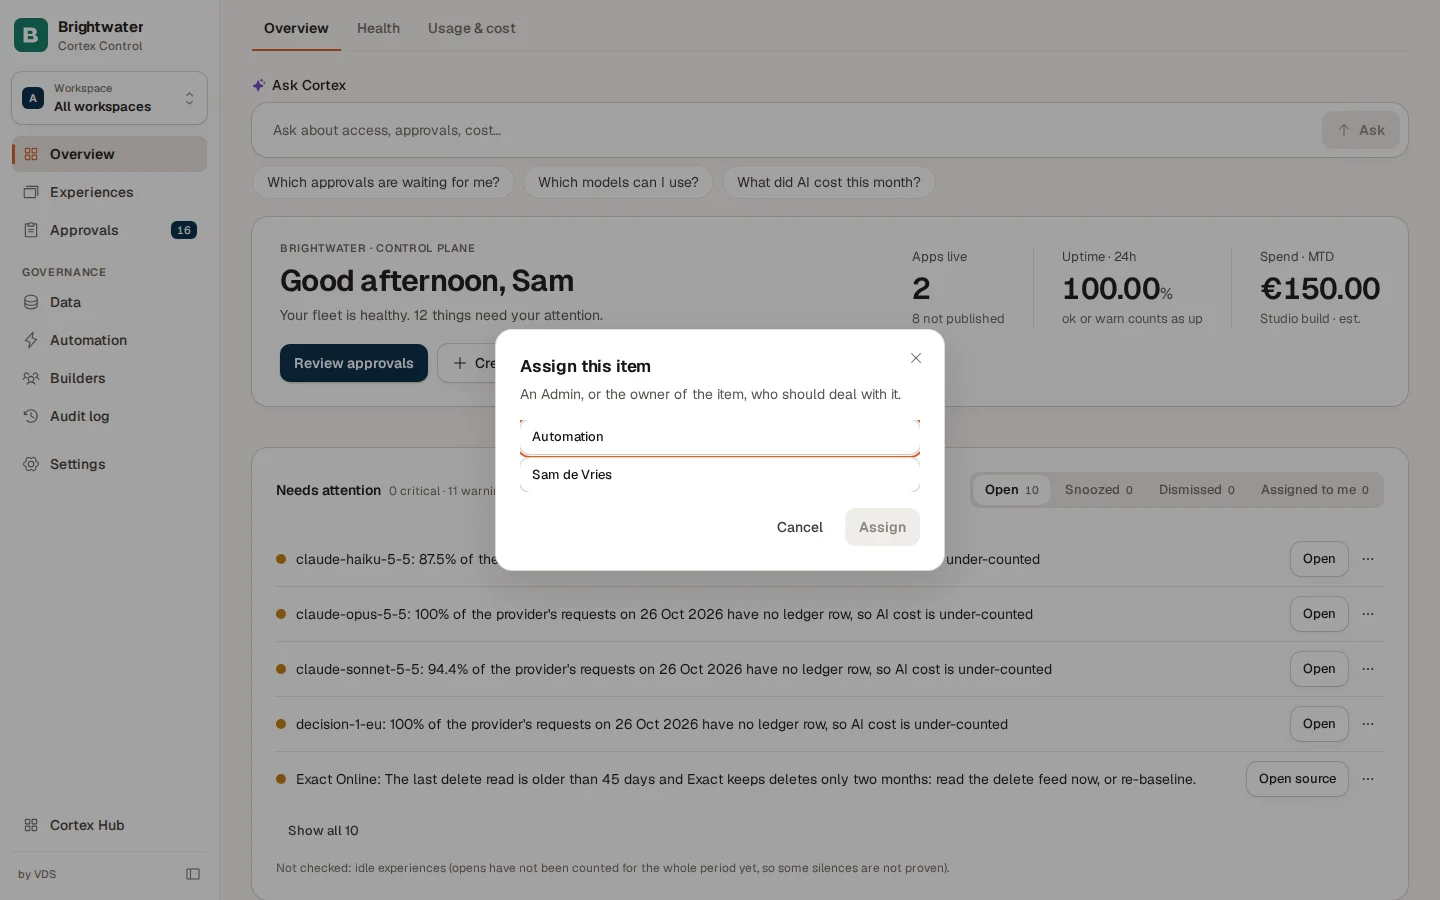
- Assign to… Gives the item to an admin or to the owner of the item.
The menu also has Snooze until a date…, Remove assignment (on an assigned item) and Show again (on a snoozed or dismissed item).
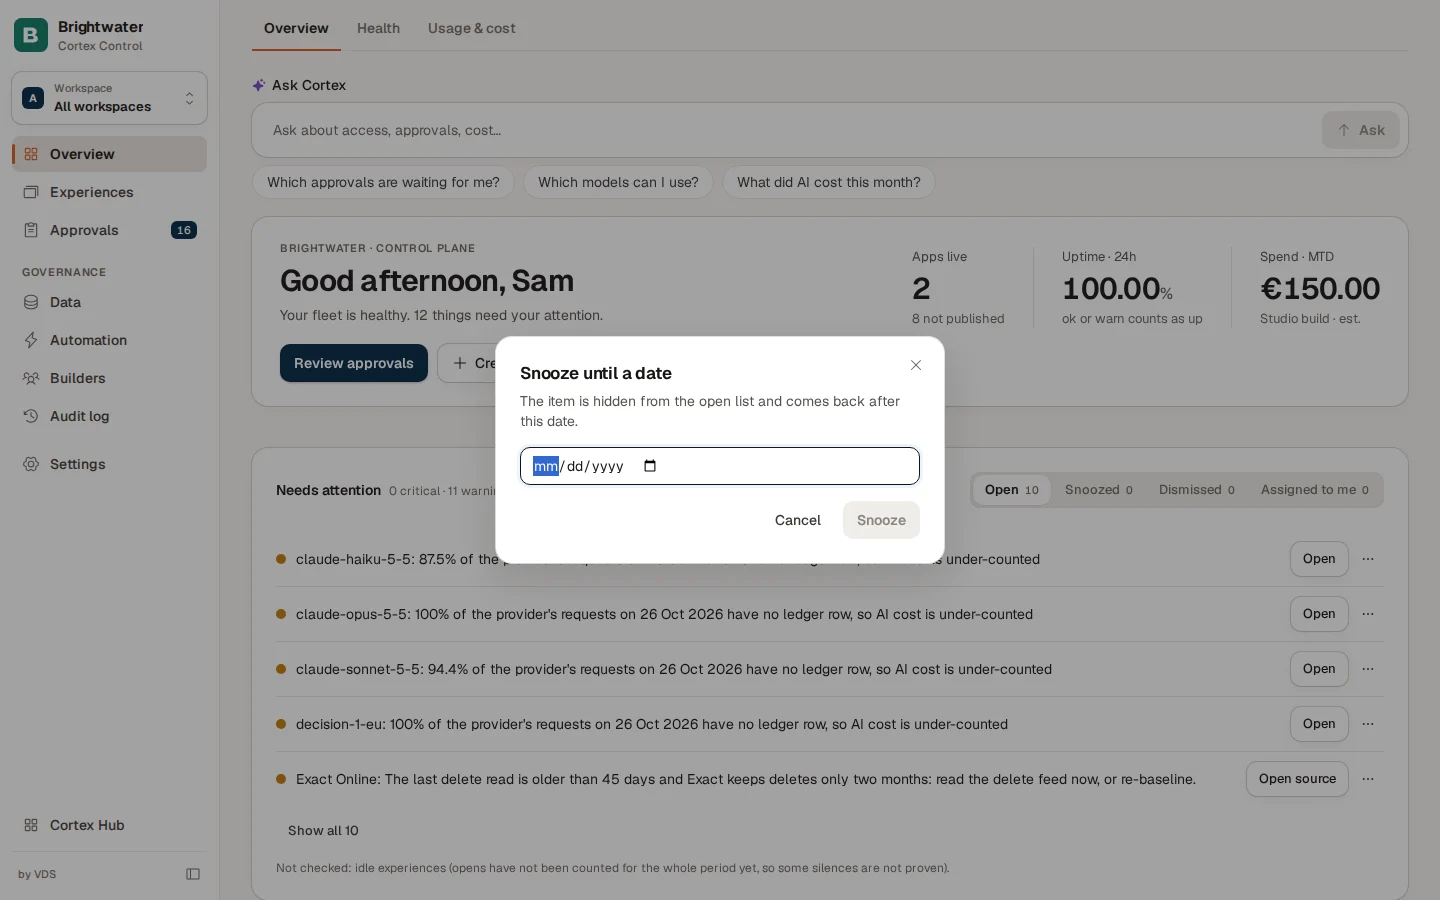
Snooze it until a date
Open the row menu and choose Snooze until a date…. In the dialog Snooze until a date pick a date under Snooze until and choose Snooze. The item is hidden from the open list and comes back after that date.
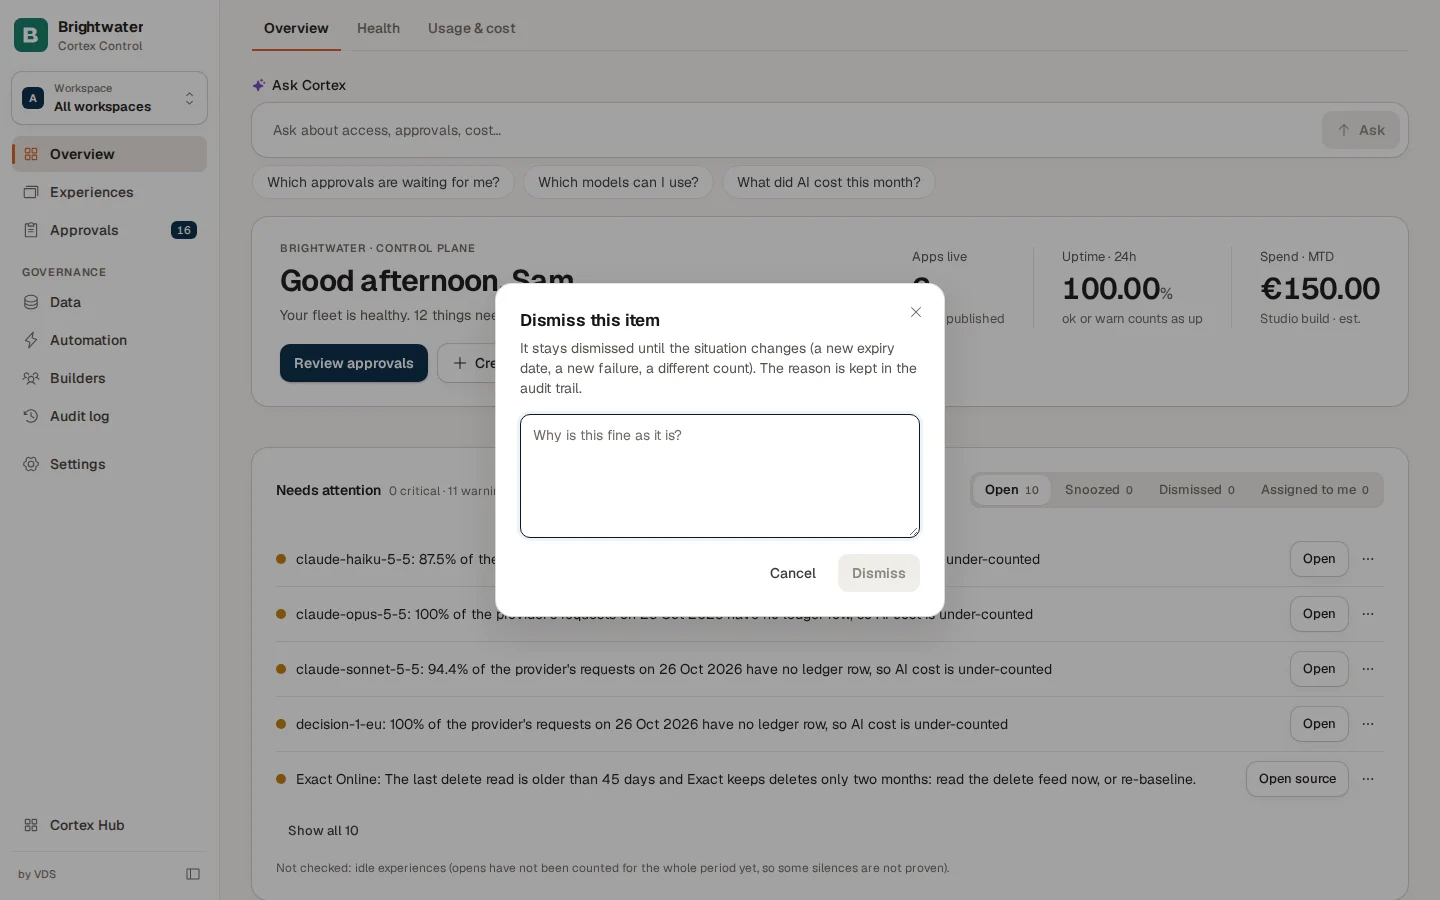
Dismiss it with a reason
Choose Dismiss with a reason…. In the dialog Dismiss this item write why it is fine as it is under Reason and choose Dismiss. A reason is required and is kept in the audit trail. The item stays dismissed until the situation changes: a new expiry date, a new failure or a different count. Then the row comes back with the note "The situation changed since it was dismissed".
Assign it
Choose Assign to…. In the dialog Assign this item pick an admin, or the owner of the item (marked "owner"), and choose Assign. The row now says "Assigned to …", and the person finds it under Assigned to me.
Find it again
Choose Snoozed (or Dismissed) in the Show switch. A snoozed row says "Snoozed until …", a dismissed row shows the reason and who gave it. Choose Show again in its menu to put it back in the open list.

Check the health of your apps
Open Overview, then the Health tab. Every environment of every app is probed once a minute. The tab shows:
| Figure | What it tells you |
|---|---|
| Environments | How many apps and environments are probed. |
| Healthy now | How many respond, and how many do not respond or are degraded. |
| Mean uptime · 24h | The uptime over all probed environments. An environment that is OK or in warning counts as up. |
| Slowest response | The slowest response time (95th percentile over the last 24 hours) and which app and environment has it. |
Under the figures a table lists each environment with Env, Last 24h, Uptime and Response.
- If an environment stops responding, a red band appears above the table with the button Open log. It disappears by itself at the first successful probe.
- To probe one app right now, use the refresh button on its row (the tooltip reads "Probe … now"). Refresh at the top reloads the whole table.
- Choose an app name to see Last checked, the HTTP status the probe got and Technical details.
- This tab lists only apps that are published and being probed. A new app that is still being set up shows as provisioning. An app that was never published is left out here and shows as Not published on the Overview tab.
Usage and cost
The third tab, Usage & cost, is for admins. It shows what each app and dashboard costs to build and run. See Usage statistics and Cost, limits and usage.
Example: the Monday morning check
Sam de Vries, IT admin at Brightwater Foods, opens Control on Monday.
- The greeting says "Your fleet is healthy. 10 things need your attention." Nothing is down.
- Needs attention shows 0 critical and 9 warnings. Two rows say the AI cost of a provider has no ledger rows. Sam snoozes them for a week, because the finance team already looked at them.
- One row says the monthly AI ceiling is close. Sam chooses Assign to… and gives it to Eva Jansen, who owns the budget. It now sits under Assigned to me in Eva's list.
- Sam chooses Review approvals in the greeting and decides the one request that has waited for days.