Dashboards
Create a dashboard with the AI assistant, check it, publish it, restore an earlier version, preview it as someone else and choose who can open it.
A dashboard is built by chatting. You describe what you want to see, and the assistant puts tiles on the canvas using the figures your organisation has agreed on (the figures in your semantic models). It never types a number itself: every number is computed from your data, for whoever looks at it. You can change anything by hand afterwards.
This page covers the editor and the life of a dashboard: create it, build it with the chat, keep or undo what the assistant did, check it, publish it, go back to an earlier version, share it and archive it. The tiles themselves (types, settings, filters, pages, phone layout) are in Tiles, filters and pages.
Who can do this
Builders (people with a Studio seat) and admins. Whether you may create dashboards depends on the builder policy your IT administrator set in Cortex Control. Changing who can open a dashboard is limited to its owner and IT. Some dashboards need a second person's approval before they go live; that is your organisation's rule.
Tell the assistant in your own words what you want to see.
Tiles appear on the canvas, from your agreed figures.
Keep or undo what it did, click a tile to change it, add your own.
Every tile is run and judged: it works, it has no data, or it fails.
A new version goes live in the Hub. Older versions stay in the history.
Create a dashboard
Start it
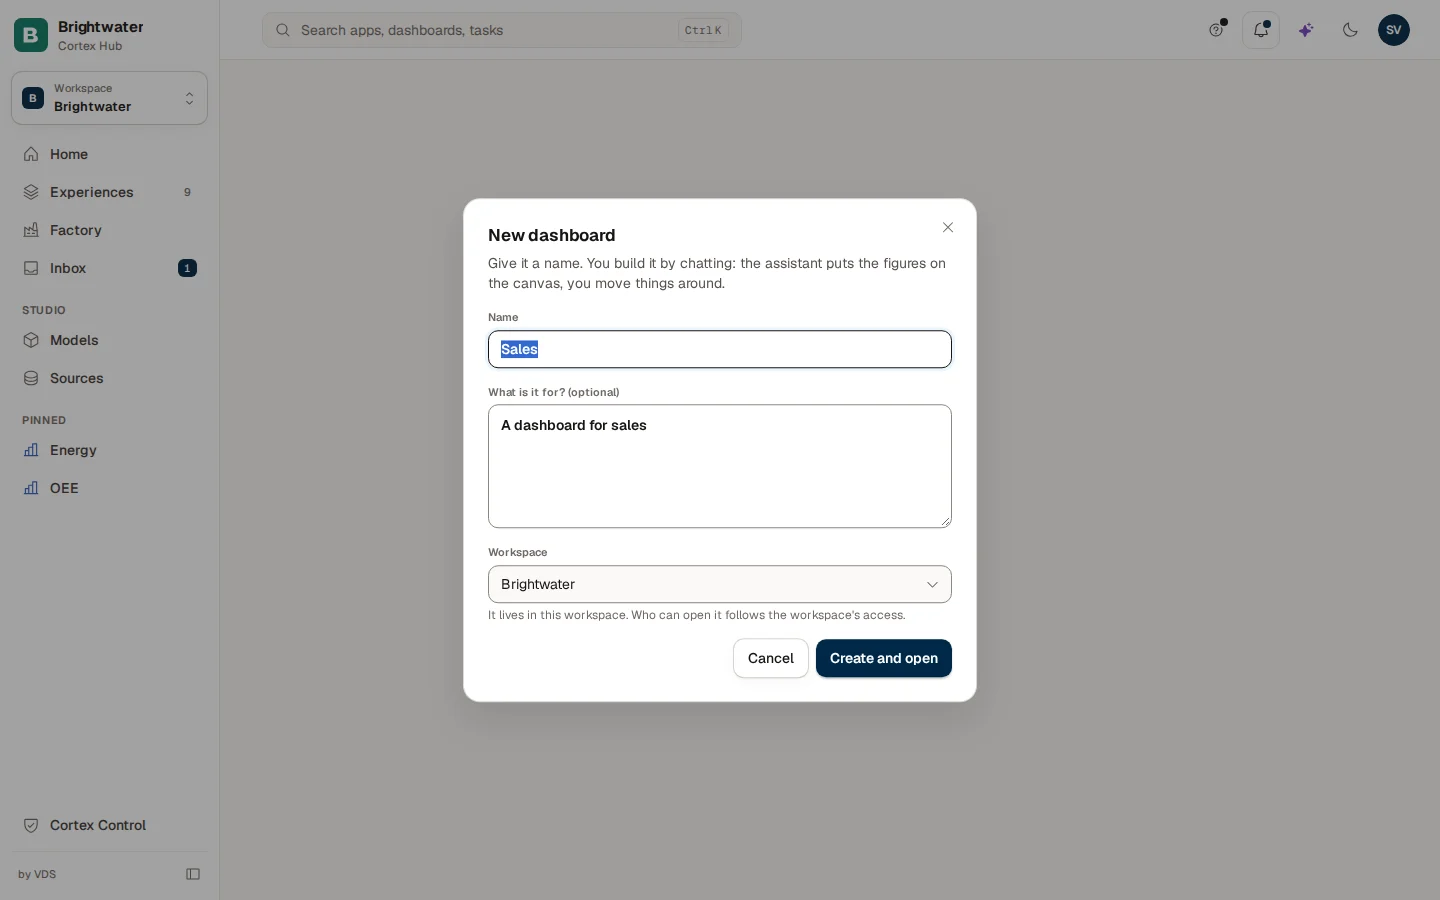
Open Experiences, choose New and pick Dashboard under "Start from scratch". Or press Ctrl+J, choose Build something and describe the dashboard in a sentence (see Start something). The dialog New dashboard opens.
Name it
Give it a Name and, if you like, say what it is for under "What is it for? (optional)". Under Data, the company option is already chosen. It shows your company name followed by "(all company data)": every tile can use any part of the company data you may read. You can pick one of the "Parts of the company model" instead, or a model under "Other models". Picking a part of the company model limits its figures to the people who may read that part. Without a company model, the default model is already chosen. With only one model there is no Data field. If you have more than one workspace, check the Workspace: "It lives in this workspace. Who can open it follows the workspace's access." See Workspaces.
Create and open
Choose Create and open. The editor opens with the chat on the left and your dashboard on the right. If you started from a sentence, it is already waiting in the chat box.
If you are not allowed to create dashboards, the dialog says "You are not allowed to create dashboards. Ask your administrator."
The editor at a glance
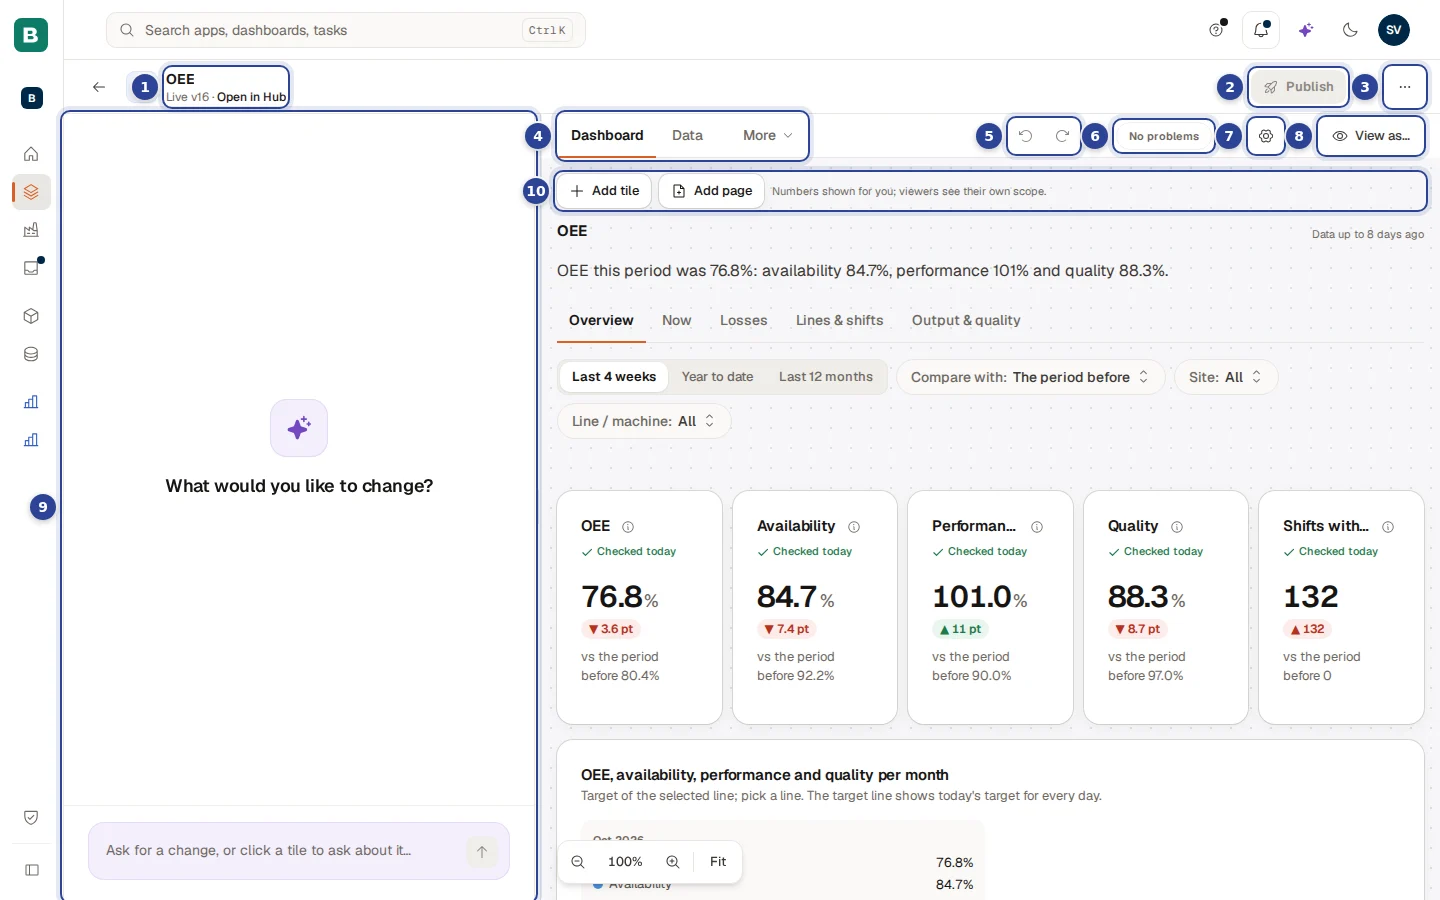
- The title and state line. The name and where you stand, for example "Live v6" or "Live v3 · 2 changes not published yet". Open in Hub opens the live dashboard.
- Publish. Opens the review before publishing (see Check and publish).
- More actions ("..."). Check, View usage, Live in Hub · Open (once it is live) and Archive.
- The tabs. Dashboard is the canvas, Data lists the fields, and More holds Spec, History, Access and Usage.
- Undo and redo. Ctrl+Z and Ctrl+Shift+Z.
- The problems chip. "No problems", or how many errors and warnings need attention. Choose it for the list; Go to takes you to the tile.
- Dashboard settings (the gear). The title, pages, filters, density and canvas of the whole dashboard.
- View as… Shows the dashboard as viewers see it.
- The chat. Tell the assistant what you want, or click a tile to ask about it.
- The canvas. Add tile and Add page at the top, then the tiles. A note says "Numbers shown for you; viewers see their own scope."
On a narrow screen the chat and the dashboard are two views: Edit by hand and Chat with the AI switch between them, and the undo, redo, settings and View as buttons move into the "..." menu.
Build it with the chat
A new dashboard is empty and the chat asks "What do you want to see?" ("Tell the AI in your own words. It builds the dashboard from the figures your company has agreed on, you watch it appear, and you can click any tile to adjust it yourself."). Under it you find suggestions made from the figures of your model, such as "Show revenue over time, month by month.", "Compare … between categories." or "I am not sure yet what I want to see. Ask me which decision this dashboard should support." Click one, or type your own in "Describe what you want to see…".
While the assistant works the tiles appear one by one and your own edits wait: "The AI is working on the dashboard. Your edits wait." If a tile did not pass the checks, a notice such as "One tile isn't on the canvas yet" explains that it stays off the canvas for now; ask the assistant to fix it.
On a dashboard that already has tiles, the chat asks "What would you like to change?" and the box says "Ask for a change, or click a tile to ask about it…".
Good things to ask for:
| You want | Ask, for example |
|---|---|
| A first overview | "Make me a one-screen overview with revenue, margin and open orders." |
| A trend | "Show revenue over time, month by month." |
| A comparison | "Compare margin between product groups." |
| A change to one tile | Click the tile, then "Make this a bar chart and show the top 10." |
| A bigger structure | "Split this into two pages: sales and production." |
| A fix | "Fix the problems the check found." |
Ask about one tile
Click a tile and the chat box says "Click a tile to ask about it · Shift-click to add more". Your next message is then about that tile (or those tiles). Use this for "show the last 12 months here" or "why is this empty?".
Keep or undo what the assistant did
After each turn the chat shows one line, for example "AI changed 2 tiles".
- Show highlights those tiles on the canvas.
- Keep accepts the change.
- Undo puts the dashboard back as it was before that turn. It is one step you can redo.
You can also use the undo and redo buttons above the canvas. If someone else is working with the assistant on the same dashboard you see "Someone else is working with the AI on this dashboard right now. You can still edit by hand." If the assistant changed the dashboard while you were editing, "Your last change was not saved; the canvas now shows the latest version." Choose Reload when the bar says someone else changed the draft.
A very long conversation says "This chat is long. Starting fresh keeps the answers quick. Your dashboard stays as it is." Start fresh clears the conversation only.
See it as viewers do
Choose View as… above the canvas. The dashboard switches to a preview: "Preview: exactly what viewers see, with your own numbers." Pick Desktop or Phone (390 px) for the width. On a phone you also get the Phone layout panel (see Tiles, filters and pages). Choose Back to editing to leave.
In the preview you can also look at the dashboard as someone else with View as… in the bar above it: A role or A person. For a person, give a reason of at least 10 characters (it is written to the log: who looked, as whom, and why), then choose Start preview. Only the owner of the model or an admin can start this, and an admin cannot be the person you look as. The banner then says "Viewing as …. The data engine applies their data scope, read-only; this is recorded in the audit log." A role on its own has no rows of its own, so figures limited by row show empty; pick a person to see their rows. Back to my own view returns. You never act as the other person.
Check and publish
Check
Open "..." and choose Check. The check runs every tile. Each tile shows Works, No data, Waiting for the model or Fails, and the whole dashboard shows All tiles fine or Needs attention. If the check cannot run, the page says "The check could not run, so the result below may be out of date." Open More > Spec to read the Validation report, with each Error and Warning, and the dashboard as formatted JSON that you can read but not edit.
Review
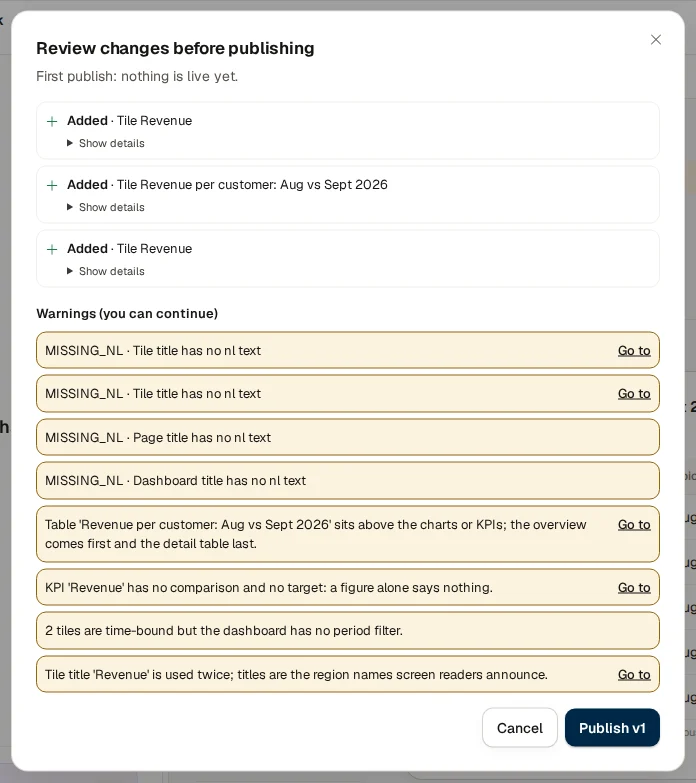
Choose Publish. The dialog Review changes before publishing lists what changed compared with the live version ("Compared with the live version 3."): tiles added, removed, changed or moved, report filters, the title, the data model. On a first publish it says "First publish: nothing is live yet." Errors block publishing, warnings do not.
Publish
Confirm with the button Publish v3 (with the next version number). The message says "Published as version 3." with a link Open in Hub. Sometimes it says "Sent for review: a second person has to approve it before it goes live." Once another person approves, it goes live.
The line under the title tells you where you stand: "Live v3 · 2 changes not published yet". When nothing changed, Publish is off: "Nothing has changed since version 3 went live." If the model changed since the last check, a banner says "Validated against knowledge version … now …. Check the dashboard again."
Go back to an earlier version
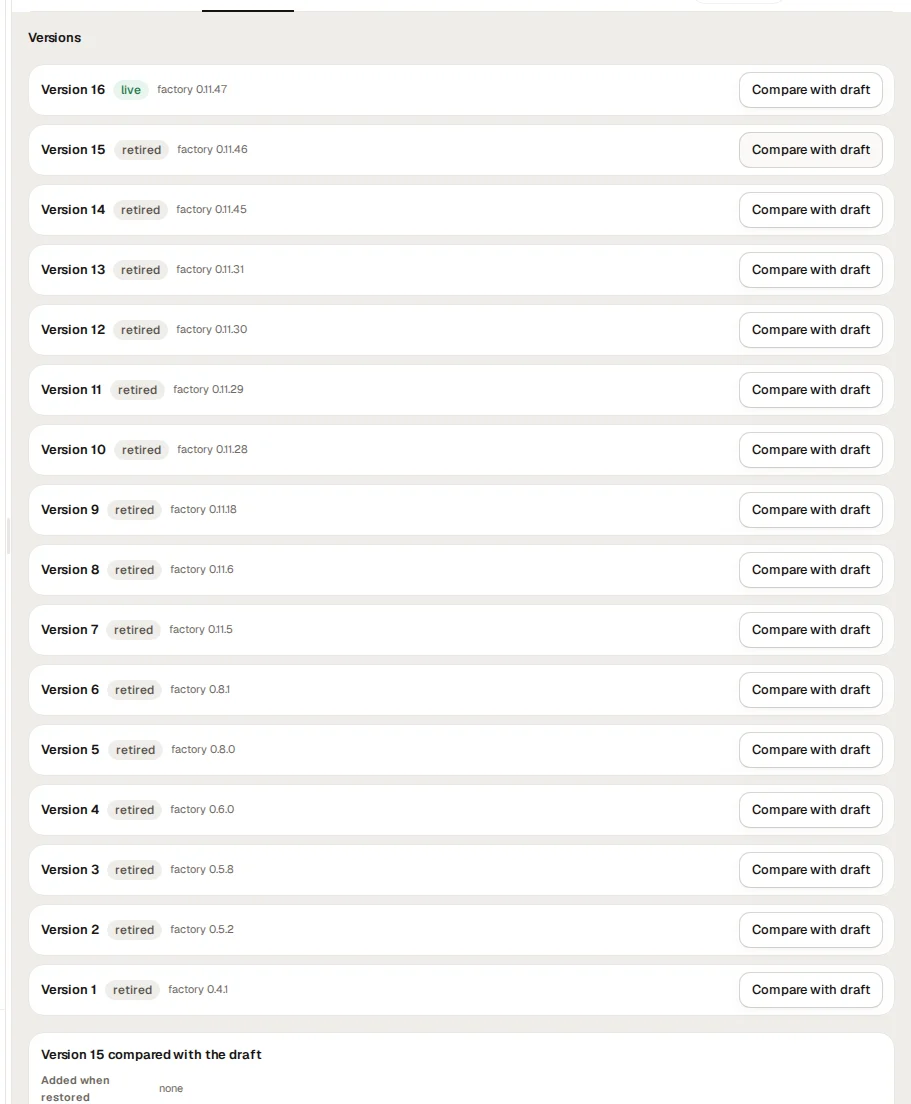
Open More and choose History. It lists every published version ("Version 1", "Version 2", …) with its status (live, proposed or another) and the summary of the change. Choose Compare with draft to see "Version 2 compared with the draft": what would be Added when restored, Removed when restored and Changed. Choose Restore to draft and confirm "Replace the draft with version 2?". Nothing goes live: "Restored to the draft. Publish it to make a new version." History is never rewritten.
Choose who can open it
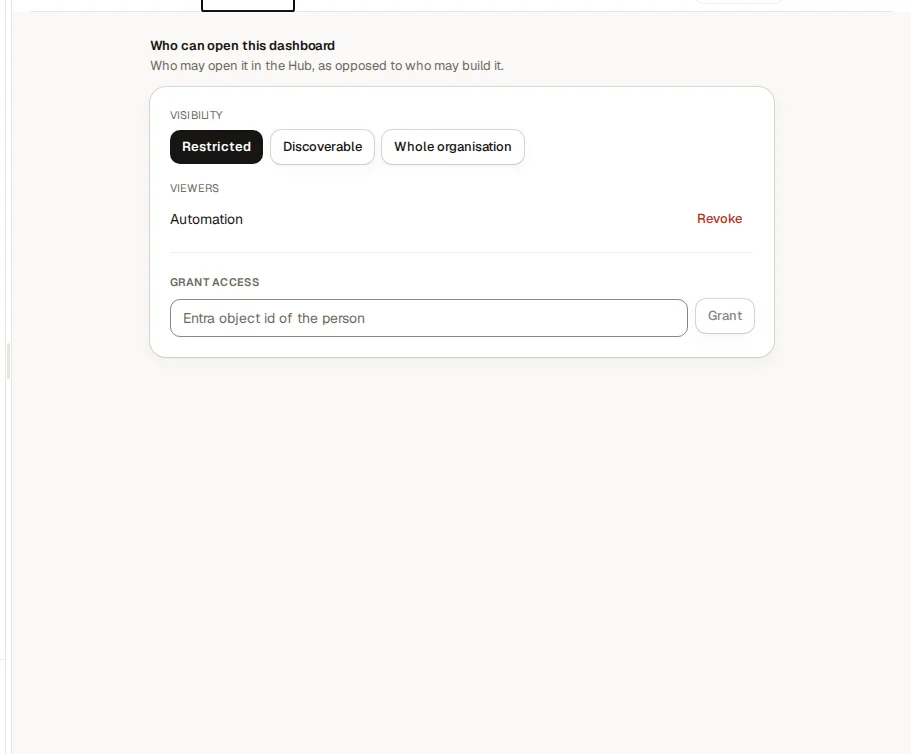
Open More and choose Access ("Who can open this dashboard"). This is about who may open it in the Hub, not about who may build it.
| Setting | What it does |
|---|---|
| Visibility: Restricted | Only the people you grant access. |
| Visibility: Whole organisation | Everyone in the organisation. |
| Visibility: Discoverable | Asks "Put this on the Hub shelf?". People who cannot open it then see its title, description and owner in Discover and can ask for access. They never see data, tiles or answers. Confirm with Show on the shelf. |
| Viewers and Grant access | Grant a named person access; Revoke takes it away. |
Only the owner or IT can change who can open a dashboard; everyone else sees "Only the owner or IT can change who can open this dashboard."
See who uses it
Open More and choose Usage. It shows views and people in the last 7 and 30 days, when it was last opened and the slowest tiles. The tile times are measured in your browser on the last load, not on the server. Usage only appears once the dashboard is live ("Usage shows once the dashboard is live."). View usage in the "..." menu opens the full usage overview for this dashboard.
Archive a dashboard
The owner of a dashboard or an admin can choose Archive in the "..." menu of the editor, or in the "..." menu of its card on Experiences. It disappears from the Hub and from the lists; a message with Undo stays for a few seconds. Nothing is deleted.
Example: a sales dashboard for Brightwater Foods
Sam de Vries wants a dashboard for the weekly sales meeting.
Create
Sam presses Ctrl+J, chooses Build something, types "A dashboard for sales" and creates it as "Sales" in the main workspace.
Describe
In the chat Sam clicks the suggestion "Show revenue over time, month by month." Two tiles appear. Sam then writes "Add the top 10 customers by revenue." The chat says "AI changed 1 tile" and Sam chooses Keep.
Adjust
Sam clicks the revenue tile and asks "Compare with last year." The tile gets a comparison. Sam moves the tiles around with the mouse.
Check and publish
In "..." Sam chooses Check: All tiles fine. Publish shows the review ("First publish: nothing is live yet.") and Sam confirms Publish v1. In More > Access Sam sets the visibility to Restricted and grants the sales team access.
Questions and problems
Start something and follow your requests
Find your way around the Studio part of Cortex Hub, start a dashboard, app or workflow from one sentence, and follow what you sent, what waits for you and what users said.
Tiles, filters and pages
Add and change tiles by hand, build pivots and drill paths, set periods and filters, use pages, a summary sentence and a phone layout.