Use a dashboard
Open a dashboard, change the period, filter, look closer at a figure, ask about a tile, export, print and read how fresh the data is.
A dashboard is a page of figures that someone in your organisation built for you: single numbers, charts, tables and rankings, all drawn from your organisation's own data. You do not build anything here. You change the period, narrow the view with filters, look closer at a figure, and ask Cortex when a number surprises you.
Every figure is computed for you with your own access. A number you may not see is not shown, and a figure that your organisation has checked says so.
Who can do this
Everyone who can open a dashboard. You see only the dashboards that were shared with you, and only the data you are allowed to see. To build or change a dashboard, see Dashboards in Studio.
Open a dashboard
Find it
Open Experiences in the menu and choose Dashboards under Type, then select the dashboard. You can also open a dashboard you pinned from Pinned in the menu, or from Jump back in on Home. To go back to the list, choose All dashboards or Experiences in the menu.
Wait a moment for the figures
The page frames itself at once and the tiles fill in as the figures arrive. A thin line above the tiles shows that the figures are being updated after you changed something.
Check who owns it
The top of the page shows the title, Data as of ... and the owner ("Owner: ..."). When the dashboard is your own unpublished draft, a note says "Your draft — only you can see it. To share it, ask a builder to publish it."
The page at a glance
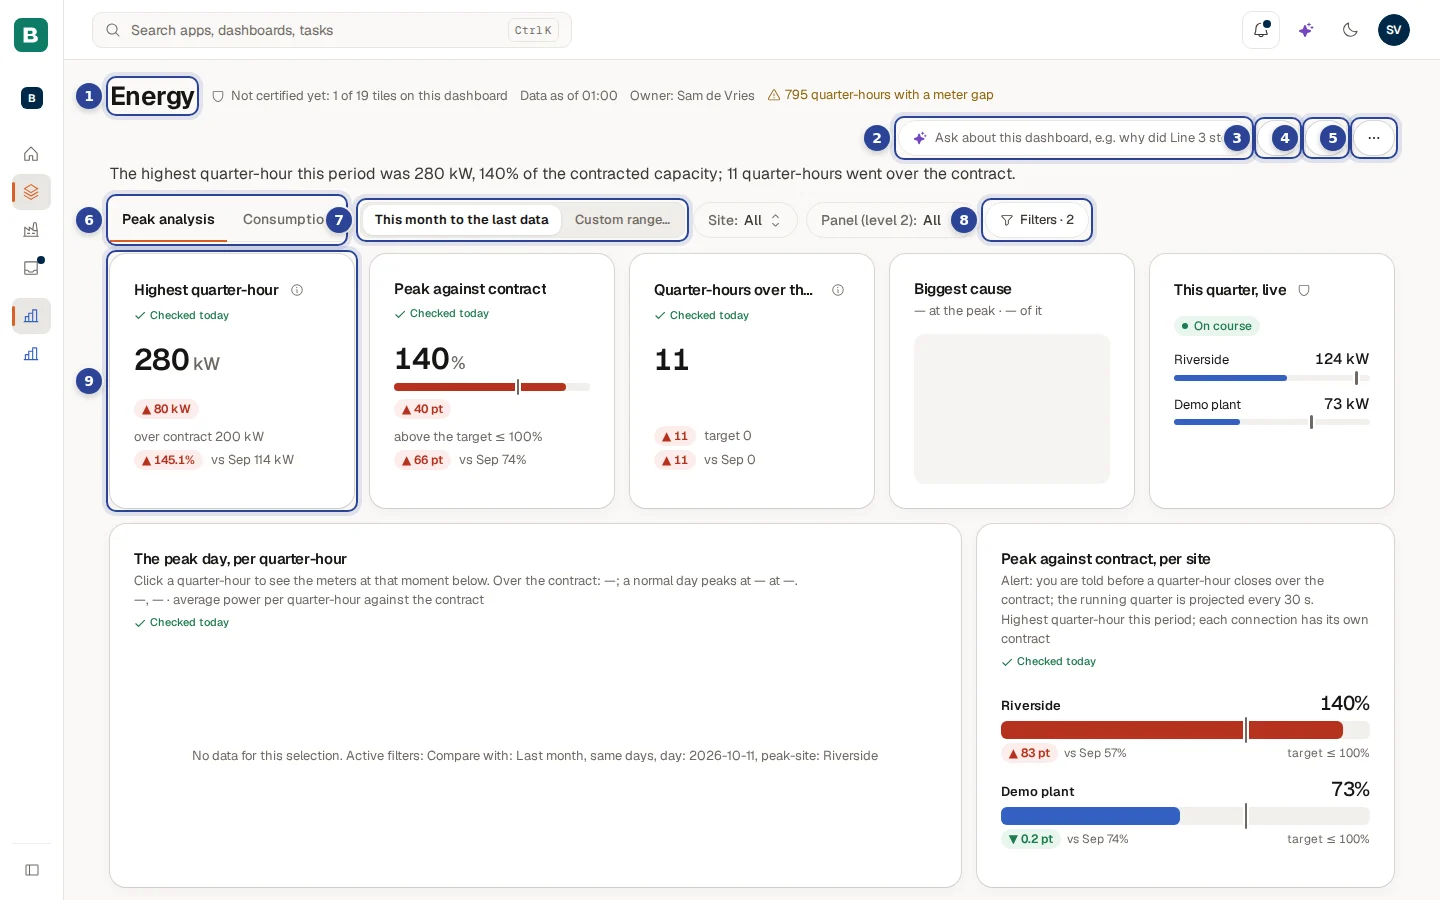
- The title. Next to it you see Data as of ... (how fresh the figures are), the owner, and sometimes a note from the maker, here a warning about meter gaps. Under the title a summary sentence is written from the live figures.
- The Ask field ("Ask about this dashboard, e.g. why did Line 3 stop?"). Type a question and press Enter. See Ask about the dashboard.
- Subscribe (the bell). Sets up a digest or an alert. See Pin a value, pin a dashboard, subscribe.
- Pin (the pin). Puts the dashboard under Pinned in the menu. When it is already pinned, the icon is crossed out and the same button is Unpin.
- More actions (the three dots). Feedback, roadmap, print and the version line. See The three-dots menu.
- The page tabs. A dashboard can have several pages, here Peak analysis and Consumption.
- The period. Here This month to the last data and Custom range…. See Change the period.
- The Filters button ("Filters · 2"). The filters that do not fit in the row sit behind it. Next to the period you also see the first filters as chips, here Site: All and Panel (level 2): All.
- A tile. One figure, chart, table or ranking. See Look closer at a figure.
Change the period

Most dashboards have a period control near the top. With five choices or fewer it is a row of buttons; with more it becomes a chip such as "Period: Last 12 months". The maker decides which choices are offered. All tiles that depend on the period update together.
Pick a ready-made period
Choose one of the periods in the control. Which ones you see depends on the dashboard.
Or choose your own
Choose Custom range… (when the maker switched it on). Two date fields appear: From and To. The range includes both days. Change a date and the tiles update.
Start over
Choose Reset filters to go back to the dashboard's own starting view. The link only shows when something differs from that start.
| Period | What it covers |
|---|---|
| This month to the last data | From the first of the month to the newest data in the system. |
| Quarter to date | From the start of the quarter until now. |
| Year to date | From the start of the year until now. |
| Last 12 months | The twelve months behind you. |
| Last year | The previous calendar year. |
| Last 30 days and similar | A rolling number of days or weeks. The maker picks the number. |
| Custom range… | Two dates you choose yourself. |
Filter
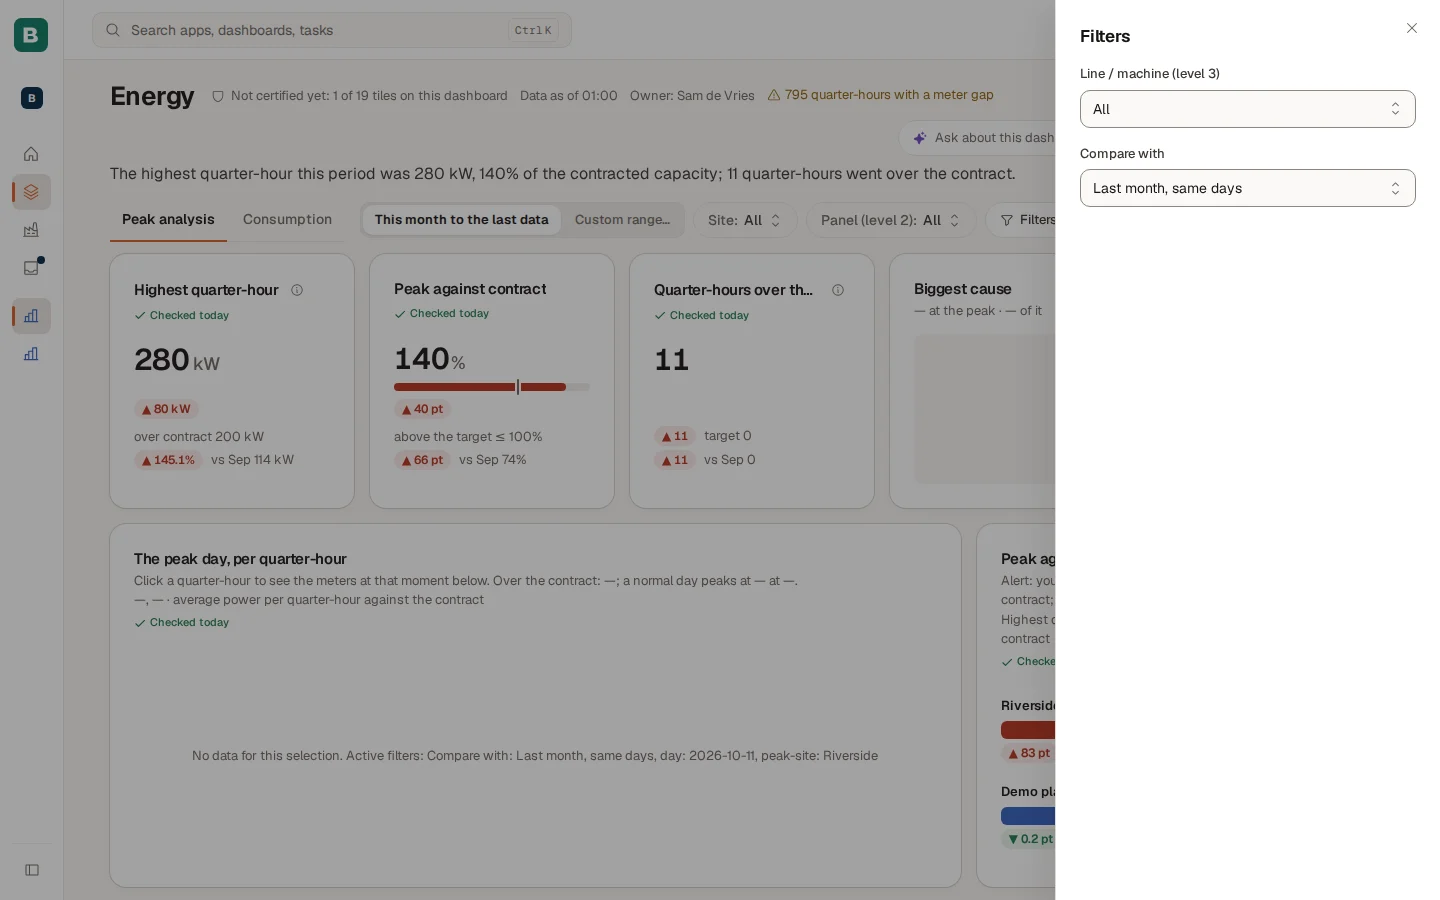
Filters sit in one row next to the period. In that row you see the period and up to two filter chips such as Site: All. Choose a chip, pick a value and the tiles update. Everything else sits behind one button, "Filters · 2", which opens the Filters panel from the right. On a small screen all filters are in that panel.
- A filter with several values you can switch on and off shows its values as buttons.
- Compare with (for example "Last month, same days") sets the period the figures are compared against. It always sits in the panel.
- Reset filters undoes all your filters at once.
Your choices are kept in the address of the page. Copy it and send it to a colleague and they open the same view, with their own access.
Pages
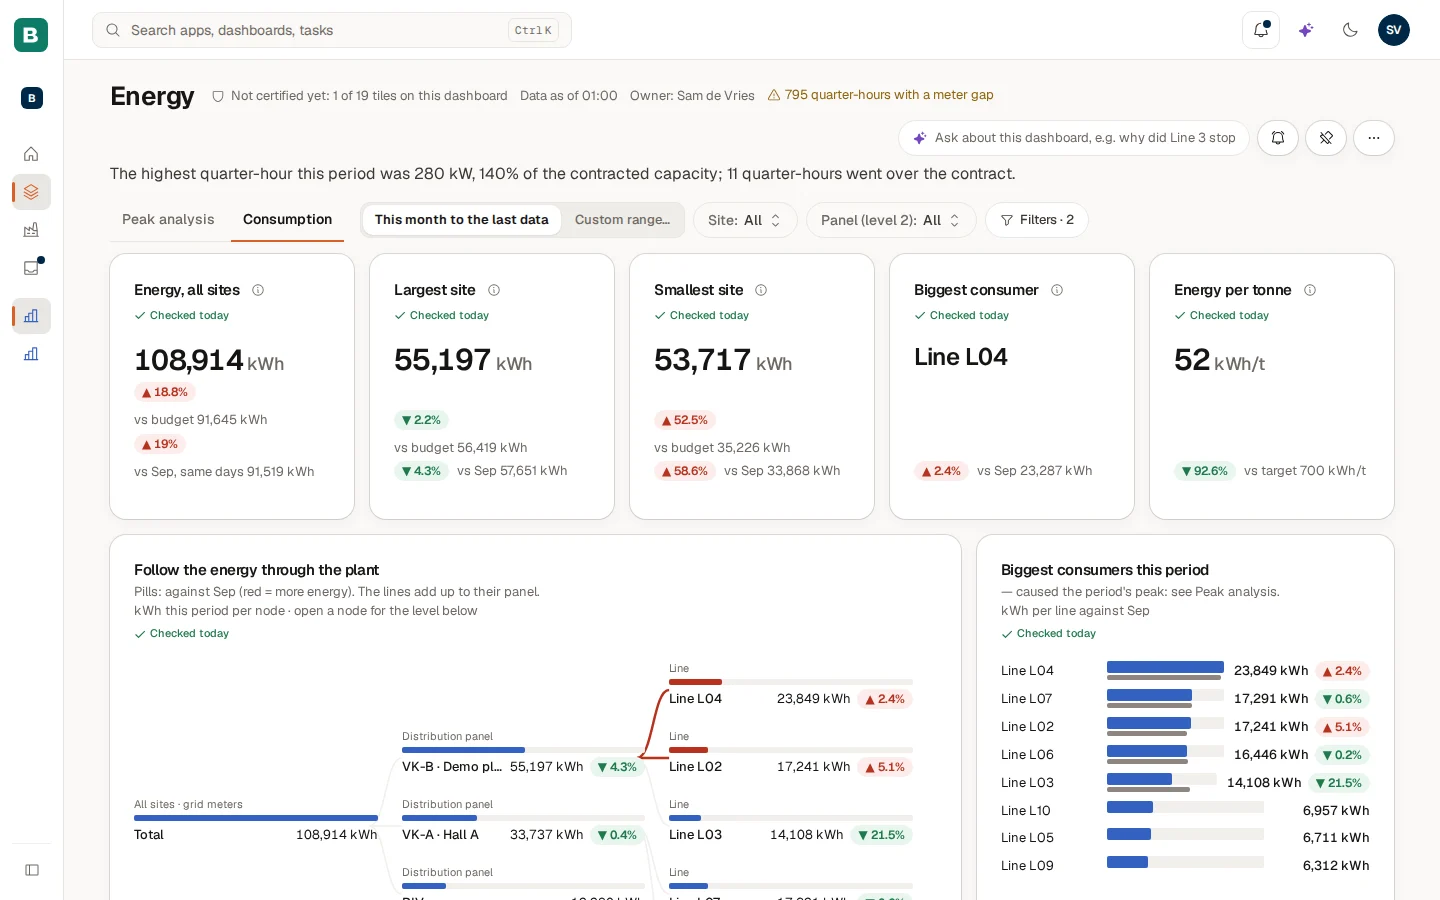
A dashboard with several pages shows tabs under the title. Choose a tab to switch page. The page is part of the address, so a link opens the same page. Your period and filters carry over.
Look closer at a figure
- Select a bar, slice or row. On dashboards where the maker switched this on, a click in one tile filters the other tiles. A chip such as "Region: North" shows the active filter. Choose its x (Clear filter) to remove it.
- Drill down. Some tiles let you go one level deeper. The Drill path above the tile shows where you are. Choose an earlier level to go back up.
- Expand a breakdown. A tile that is a breakdown has rows you can open to see the level below.
- Open a record. On some tiles a name opens a side panel with details. Open full page in that panel opens the record's own page, see Apps, workflows and records.
- About this figure. The small info icon next to a tile's title explains the figure in words.
What the marks on a tile mean
| Mark | What it tells you |
|---|---|
| Certified | Your organisation checked and approved every figure on this tile. The mark shows when you hover over the tile. See Certified figures. |
| A small grey shield beside the title | At least one figure on the tile is not certified yet. Hold the pointer over it to read that. The top of the dashboard says it once, for example "Not certified yet: 2 of 9 tiles on this dashboard", with a link to what that means. |
| Checked today | The figure is certified and last night's automatic check matched. After a gap you see the date of the last good check instead, for example "Checked 24 Oct". Choose it to see how the figure is checked and how often it matched. |
| Ad hoc · not certified | The figure comes from a file someone added by hand. It is never certified. |
| A coloured pill such as "+17.4%" | The change against the comparison period. The comparison, for example "vs Sep", sits beside it. |
What can I do with a tile?
When a tile has data, small icon buttons appear when you hover over it. On a phone or tablet you open them with Tile actions (the three dots on the tile). Which buttons you see depends on the tile.
| Button | What it does |
|---|---|
| View as table / View as chart | Shows the numbers behind a chart, and switches back. |
| Export data | Downloads the rows as a file. Masked values stay masked. When the export is cut short you are told so. |
| Ask about this tile | Opens Home with a question written for you from the tile, its filters and its period. Nothing is sent until you choose Ask Cortex. Change the text first if you like. |
| Pin to Home | Keeps the value on your Home. Offered on single-number, bar, table and ranking tiles. See Pin a value, pin a dashboard, subscribe. |
| Refresh | Asks for the figures again. |
Ask about the dashboard

The Ask field in the header is for questions about the dashboard as a whole. Press Enter and Cortex opens the answer on Home at once. The dashboard, the period and your filters travel along as words in the question, so you do not have to repeat them. The answer follows the rules of Ask Cortex: your own access, a source under every figure.
The field is not offered while you look at a dashboard as another person (a maker's preview), because the question would be asked as you.
Ask about this tile is the tile version. It puts the question in the box on Home without sending it, so you can edit it first.
The three-dots menu
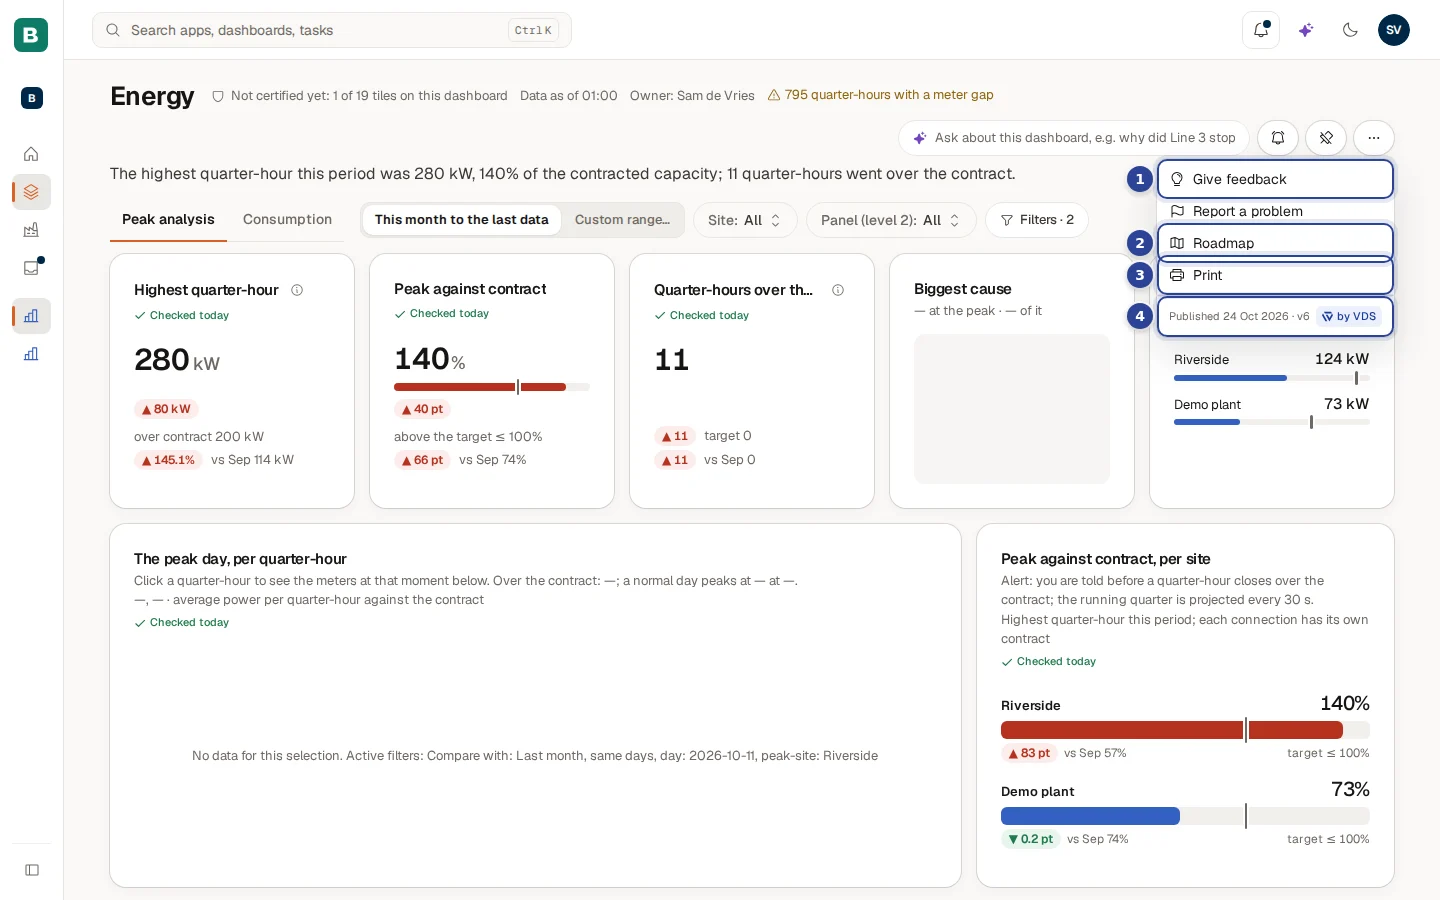
- Give feedback. Send an idea to the people who look after the dashboard. Under it sits Report a problem. Both open the same message box, see Feedback and the roadmap.
- Roadmap. What is planned, in progress and shipped for this dashboard, based on feedback from the people who use it.
- Print. Prints the dashboard. A dashboard with several pages prints every page.
- The version line. For example "Published 20 Oct · v3": which published version you are looking at. A mark such as "Ready-made" next to it means a ready-made dashboard from a curated pack.
A maker or administrator also sees View as… (look at the dashboard as another role or person) and Edit canvas in this menu. They are not shown to other people.
A board with many pages: the OEE dashboard
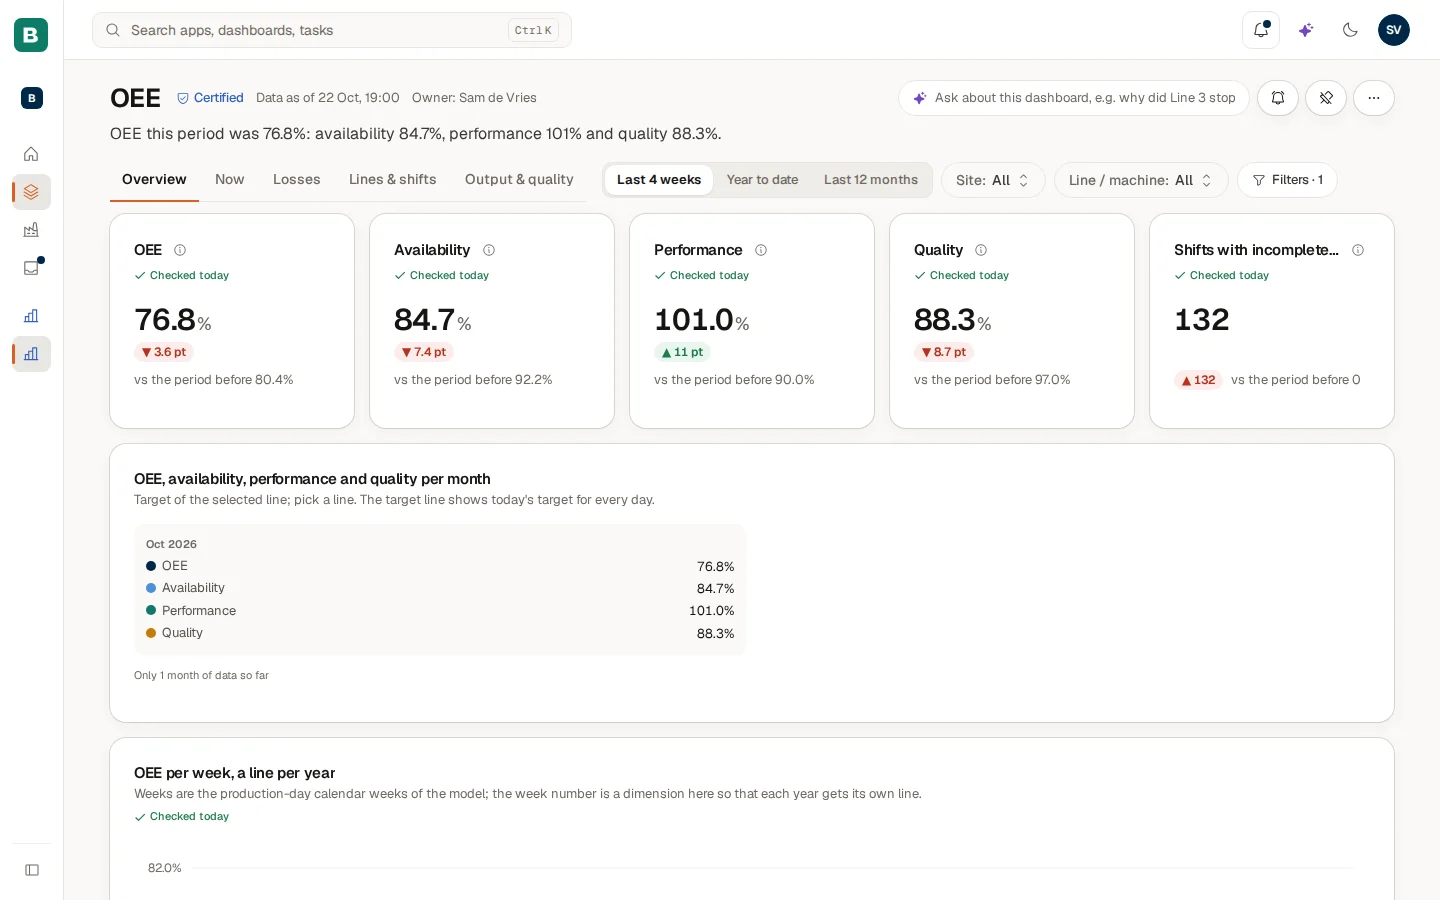
Nothing on this board works differently from the Energy dashboard. What you notice is its size. The five pages split the story: the overview, what is happening now, where the losses are, how lines and shifts compare, and the output. The Certified mark next to the title says that every figure on the dashboard is approved, and Data as of 22 Oct, 19:00 says when the newest data arrived. The period has three buttons here (Last 4 weeks, Year to date, Last 12 months), and every figure shows a comparison with the period before.
How fresh is the data?
Three places tell you how old the figures are.
- Data as of ... in the dashboard header: the time of the oldest data the dashboard reads. If a dashboard reads several sources, a tile can name them, for example "Data as of OEE 10:41, ERP 09:35".
- The data freshness pill in the top bar, left of the bell, on every Hub page. Choose it to open a short explanation.
- A note on the tile when something is wrong with the source (see the table below).
The pill shows a dot (green, amber or red), text such as "3 sources synced" or "1 source late", and the age of the oldest data. Hold the pointer over it to see the exact time.
The popover is titled Data freshness. For everyone it tells you when the data was last updated, or says that some data is late or that an update failed and that you see the last good figures. A key user or administrator also sees the list of Sources (each Up to date, Late or Failed to sync, with a time) and a link to Open mirrored data in Studio or Open in Control. The pill is hidden when Cortex does not know the status yet. It is never shown green by default.
| Pill | Meaning |
|---|---|
| Green dot, "N sources synced" | Every source delivered on time. |
| Amber dot, "N sources late" | A source has not delivered when expected. The figures are as of the time shown. |
| Red dot, "N sources failed to sync" | An update failed. You see the last good figures. Tell your key user when you rely on them today. |
What do the messages on a tile mean?
| Message | What to do |
|---|---|
| "No data for this selection" | Nothing matches your period and filters. Change them. The message also lists the active filters. |
| "You do not have access to this figure" | Your role may not see this number. Ask the owner of the dashboard. |
| Withheld | Cortex hides the number on purpose: it is built on a masked column and on fewer rows than the minimum, so it could point at one person. |
| "Data may be out of date" | The source is late. Check the freshness pill. |
| "Source is reloading — showing data from ..." | The source is being refreshed. You see the last good data meanwhile. |
| "Source unavailable — showing the last good data from ..." | The source cannot be reached. Use the figures with care. |
| "This figure can't be calculated" | The tile asks for something the data cannot give. Tell the owner. |
| "Couldn't load" | Choose Try again. |
Example: Sam checks the energy peak
Sam de Vries at Brightwater Foods opens the Energy dashboard on Monday morning. The summary sentence says the highest quarter-hour this period was 280 kW, 140% of the contracted capacity, and that 11 quarter-hours went over the contract.
- On the Peak analysis page the first tile shows 280 kW, with a red pill that it is 80 kW over the contract of 200 kW.
- Sam hovers over the Biggest cause tile (it names Line L06) and chooses Ask about this tile. Home opens with a question already written, including the period.
- Sam adds "and what happened at 09:00?" and chooses Ask Cortex.
- Back on the dashboard Sam chooses Custom range…, picks the first of the month as From and today as To, and sees whether last week was an exception.
- Satisfied, Sam chooses Subscribe and sets an alert for the peak, see Pin a value, pin a dashboard, subscribe.
Questions and problems
Experiences
The catalogue of everything you can open in Cortex Hub, dashboards, apps and workflows, with filters, two views, pins and a shelf for what you can still ask access to.
Pin a value, pin a dashboard, subscribe
Keep a figure on Home, pin dashboards and apps in the menu, and get a digest or an alert by email, in the Hub or in a Teams channel.