Semantic models
Create a model, add tables and relationships, explore and secure it, check its health, publish it and bring an earlier version back. Everything the model studio does, tab by tab.
A semantic model is one subject area, for example Sales or Production: the tables, relationships and formulas that every app, dashboard and Ask calculates from. The agreed figures in it are what dashboards show. Because everyone reads the same definition, "revenue" means the same thing in a dashboard, in an app and in an answer from Ask. For the idea behind it, see Semantic models.
You build and maintain a model in the model studio: a page with tabs. This page walks through all of them, in the order you meet them, and ends with publishing. The figures have their own page (Figures and certification), and so do the nightly checks (Model checks) and the documents (Documents and sources).
Who can do this
Builders (people with a Studio seat). The person who creates a model becomes its first owner. Changing and publishing a model is for its owners (and admins). Everyone else sees the read-only Model guide (see below).
The list of models
Open Models in the Studio group of the left menu.
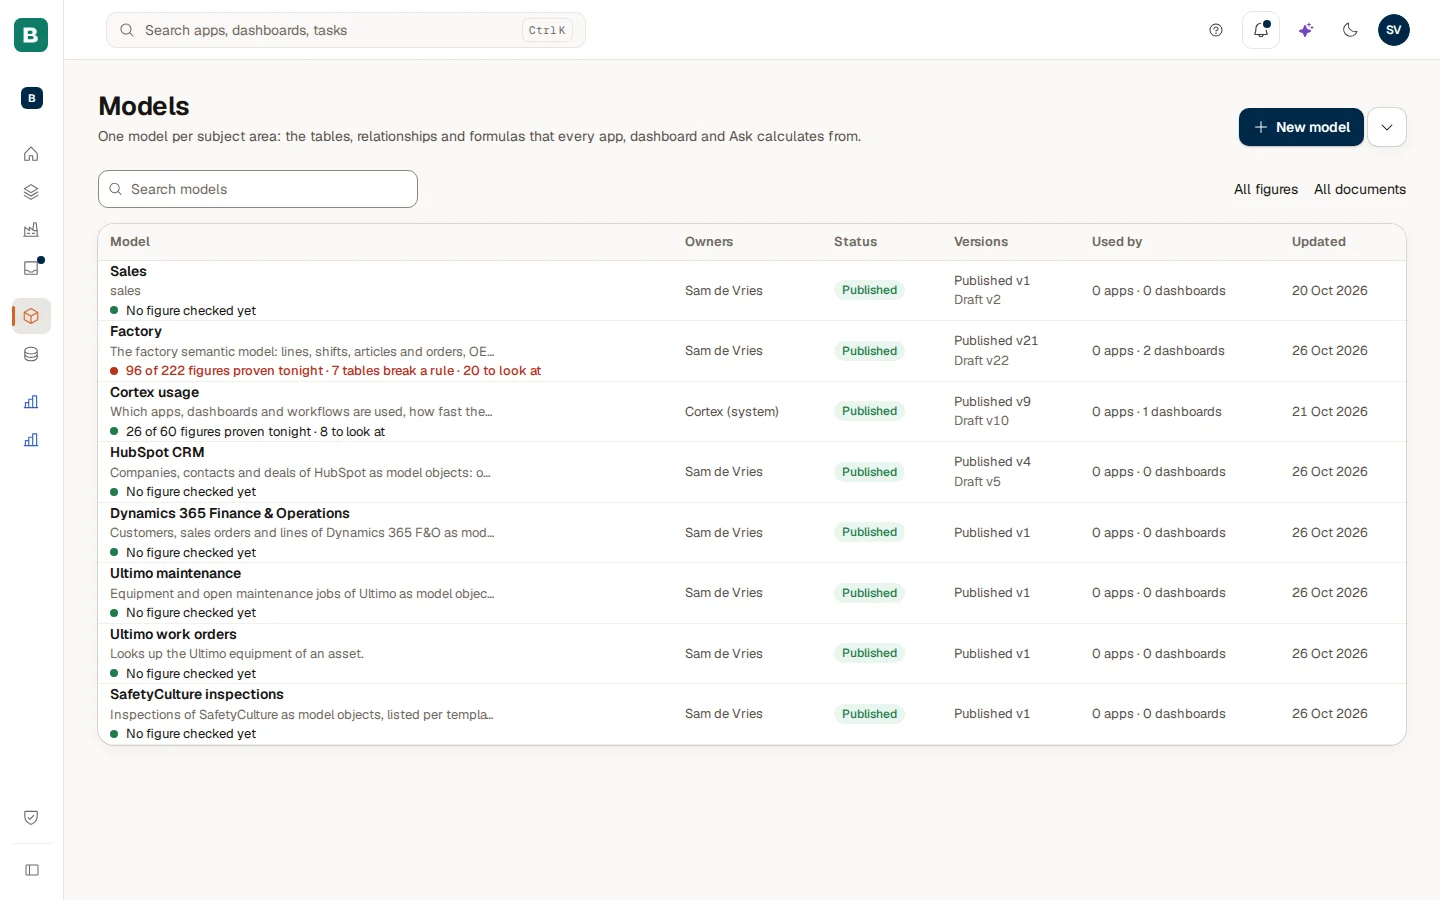
Each row shows the model with its owners, its status (Draft or Published), its versions, what uses it (for example "3 apps · 2 dashboards") and when it was last updated. Use Search models to filter the list. All figures and All documents at the top open lists across all your models. The menu More ways to start: starter pack or import next to New model offers From a starter pack, Import from Power BI (see Import from Power BI), Import an envelope file and Import an OSI file.
How do I create a model?
Start a new model
Choose New model. The dialog is called "New semantic model".
Name it
Give it a Name, for example "Sales". Under More options you can add a Description ("What is this model for, and who uses it?"). The Model id is made from the name. It is used in links and cannot be changed later: 3 to 40 lowercase letters, digits or hyphens, starting with a letter and not ending in a hyphen.
Create it
Choose Create model. You become its first owner and land in the studio. If the id is already taken, the dialog says "That model id is already taken." Edit the name or the id.
What do I see when I open a model?
A model opens on its Overview. It is a short summary made of parts that each lead to a tab.
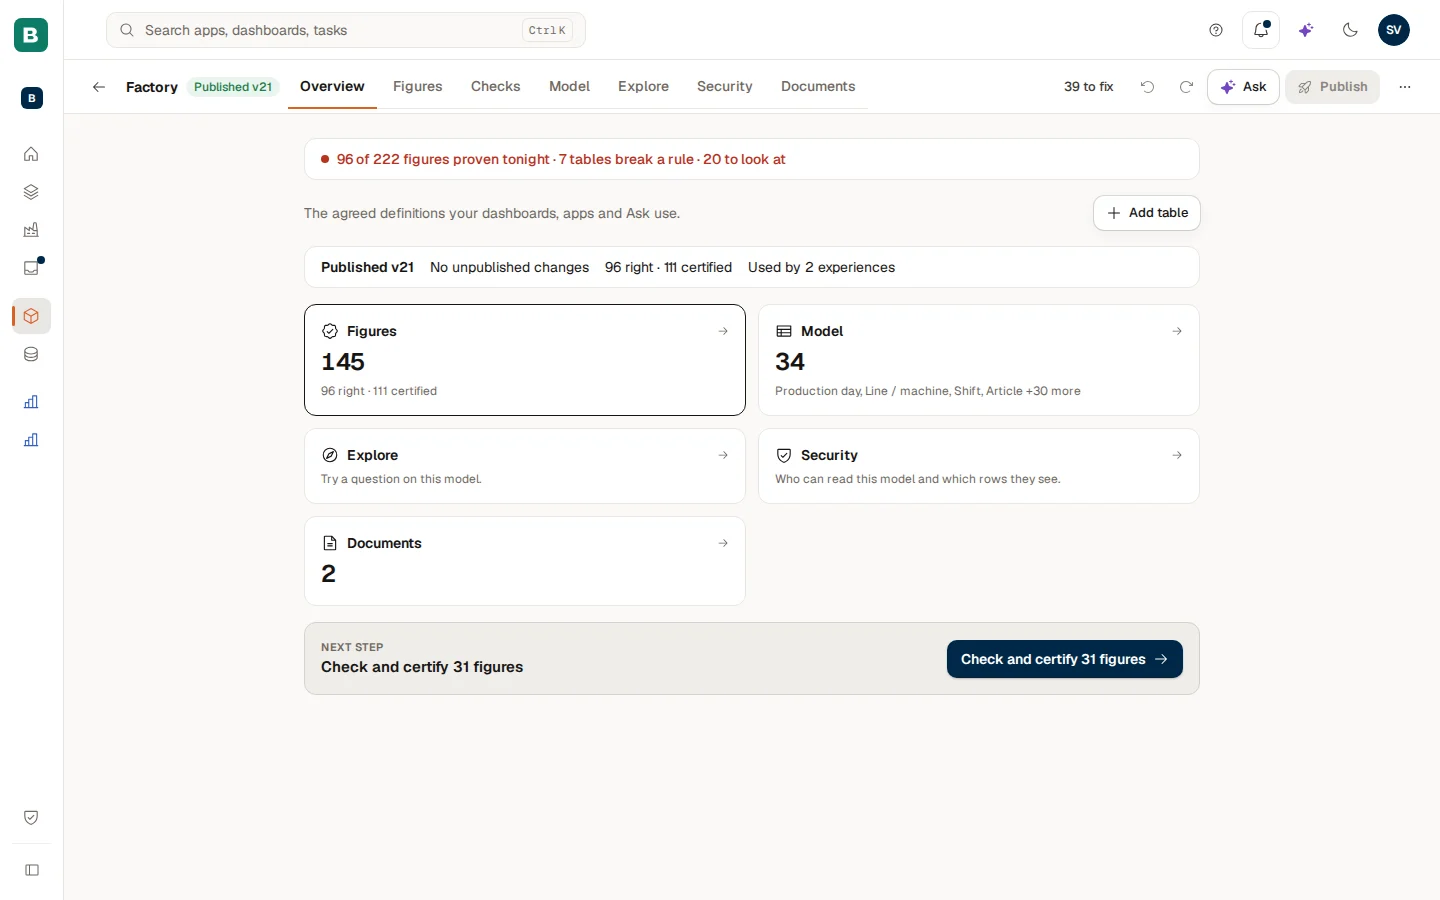
From top to bottom the Overview shows:
- The night's result, a one-line summary of the nightly checks such as "25 of 30 figures proven tonight · 1 differs · 8 to look at", with a link to the Checks tab. Only owners and builders see it.
- The state strip: Published v3 (or "Not published yet"), "No unpublished changes" (or "3 unpublished changes", which opens the Publish tab), "v4 waits for approval" when an older version is still waiting, how many figures are right and certified, and "Used by 2 experiences".
- Five parts, each a card that opens its tab: Figures (how many, and how many are right and certified), Model (the tables), Explore, Security and Documents.
- Next step: one suggestion, such as Add your first table, Describe your first figure, Check and certify 21 figures, Publish the draft or "All figures are checked". Choose the button to go straight there.
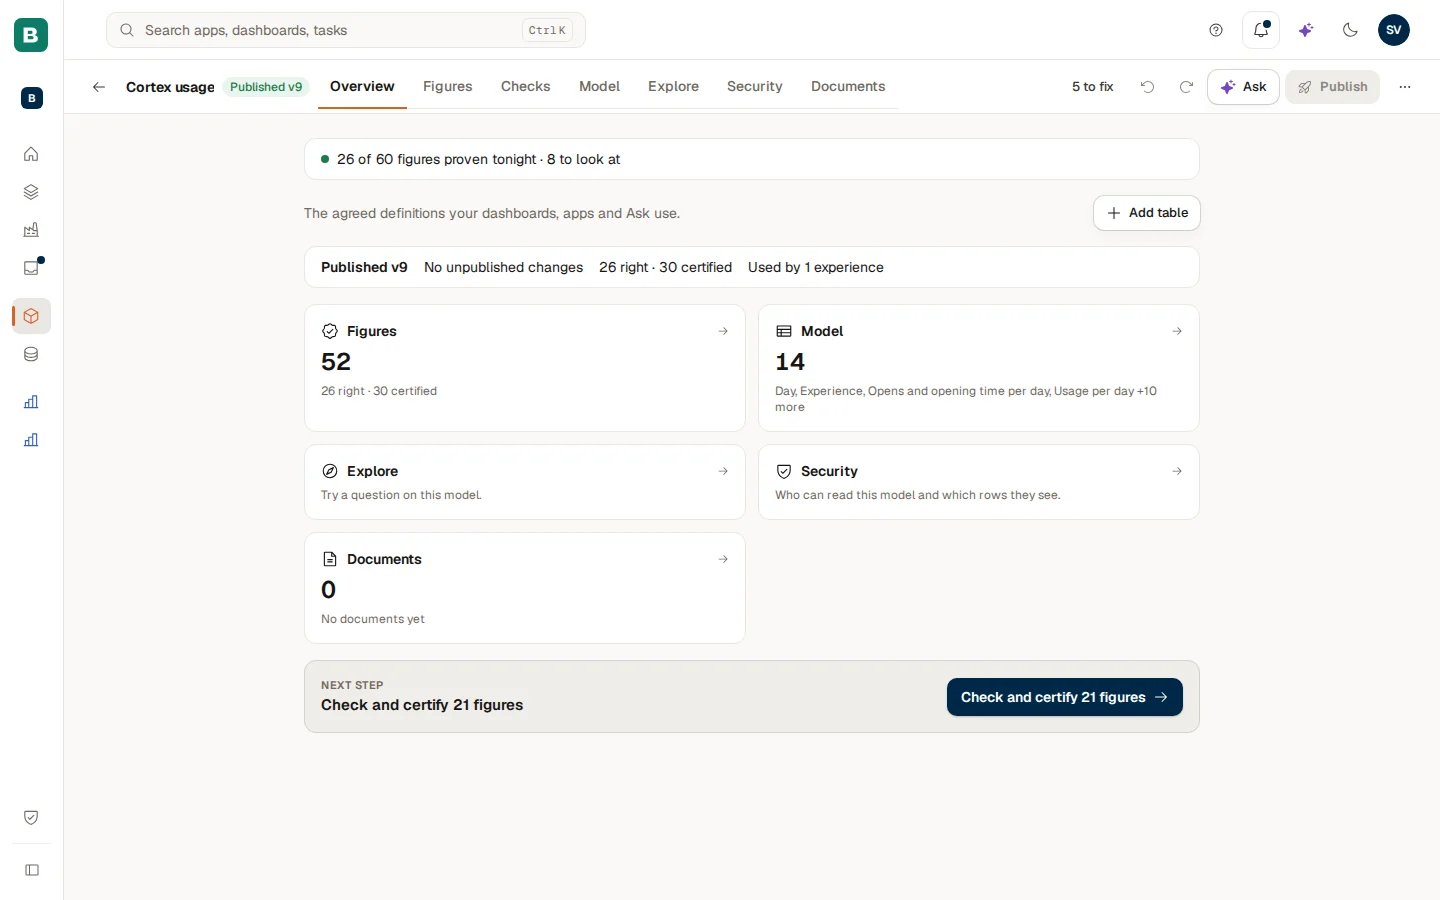
The tab bar of the studio reads Overview, Figures, Checks, Model, Explore, Security and Documents. The top bar also holds:
- a status chip with what is left to do ("3 to fix") that opens Health (see Health: what to fix next),
- the undo and redo arrows,
- Ask, an assistant for the model ("Ask about your model…") whose changes you can Keep or Undo all,
- Publish, and a ... menu with Includes, Export a version, Import a model and Settings.
Everything you change is saved in the draft of the model. Nothing reaches dashboards, apps or Ask until you publish.
The tabs at a glance
| Tab | What it is for |
|---|---|
| Overview | The state of the model and the next step. |
| Figures | The agreed numbers, their meaning and their proof. See Figures and certification. |
| Checks | What Cortex checks every night. See Model checks. |
| Model | The tables and relationships as a map, and the model as code. |
| Explore | Try a question on the model, or run a SQL query. |
| Security | Who sees which rows, tables and figures, and which apps and AI tools may use the model. |
| Documents | The manuals and procedures that Ask can quote. See Documents and sources. |
| Health (the status chip) | One list of what to fix next. |
| Publish (the button) | Make the draft live, and the version history. |
The Model tab: tables and relationships
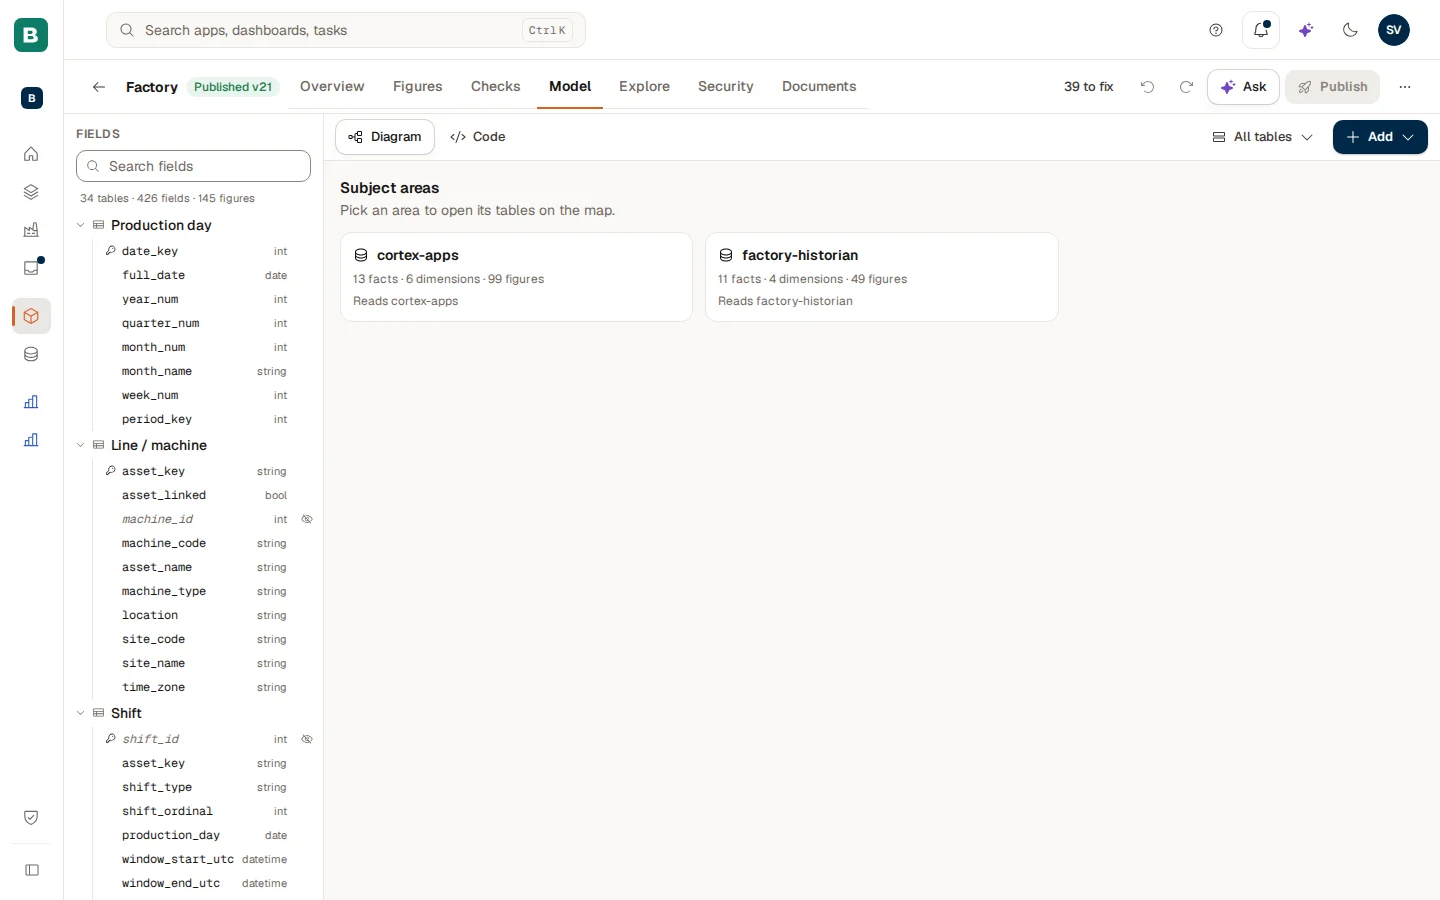
The Model tab shows the tables of the model as a map. This is where you add tables, relate them and describe what each table and field means.
How do I add tables?
Pick a source table
Choose Add and then Add table, or use the Add table button on the Overview. The dialog says "Pick a source, open a schema and add a table to the draft." You can also open the Sources list and drag a table onto the canvas. A table that is already in the model says In model.
Describe it
Select the table. The Properties panel shows its display name, Description, Table type, Key fields and, per field, the type, whether it Contains personal data, Hide from pickers and Masking. A fact table holds events or lines such as orders or invoices; a dimension describes things such as customers or products; a bridge links two others. Grain (one row is one…) says what a single row stands for.
Look at the rows
The Data tab of the panel shows the first rows, either As the model sees it (after you published) or the Raw source. A column can be profiled: its distinct values, empty values, lowest and highest value and the most common values. Removing a table from the model never touches the source table.
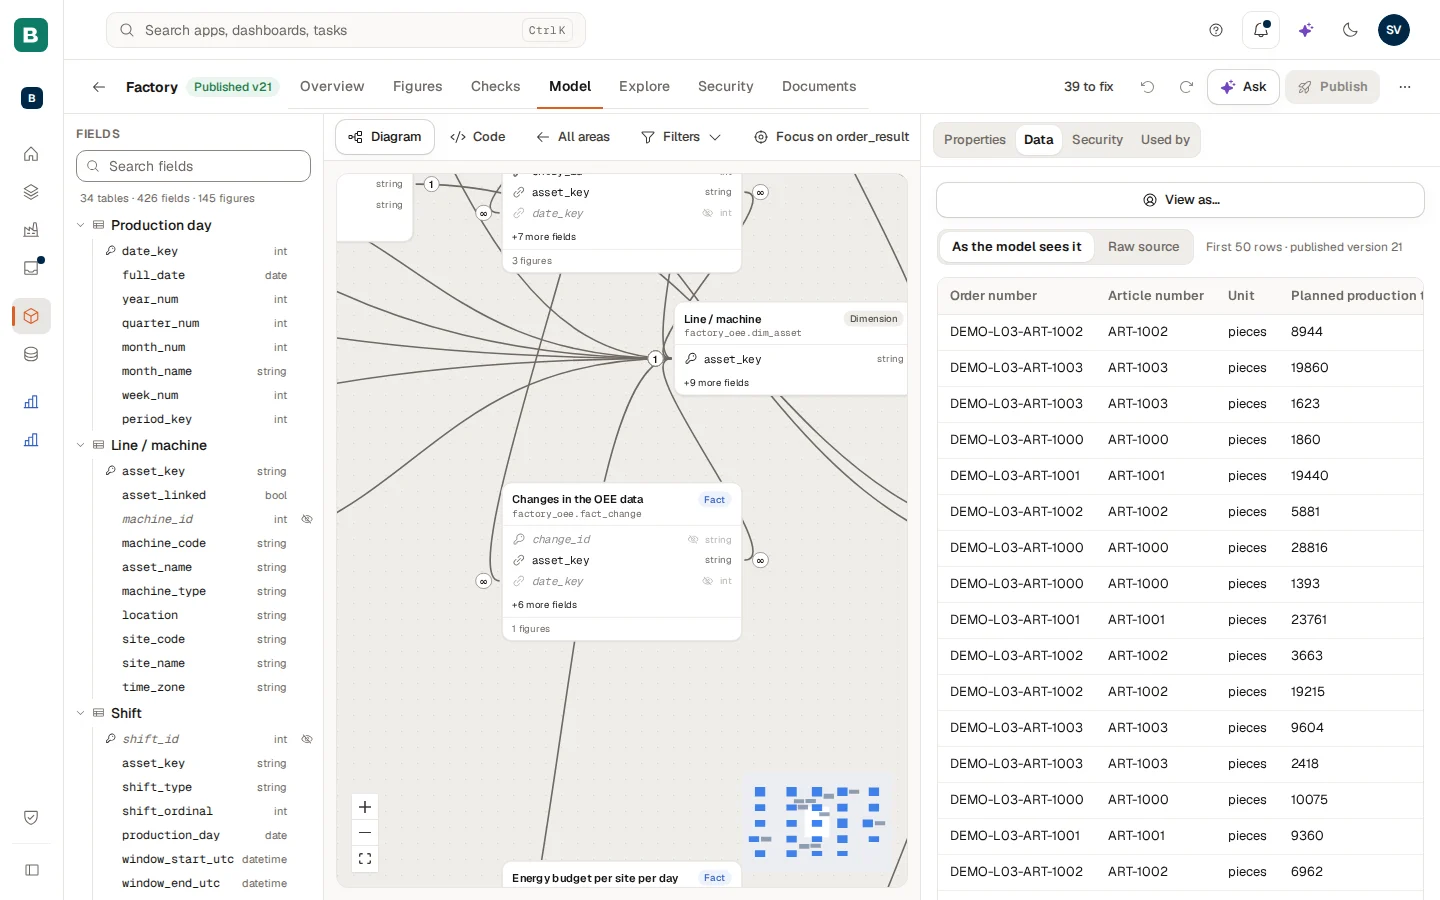
The panel has four tabs when you select a table, a field or a figure: Properties, Data, Security (the rules that apply to it, owners only) and Used by (what else in the model uses it). Choose Open table page to see the table on its own page (see A table on its own page).
How do I tell the model that a field holds map codes?
Select the field and open Properties. For a text field (and for a whole-number field that holds a 2-digit postcode area) the panel has a Map role: Province (PV27), Municipality (GM0363), Postcode area, 2 digits (10) or Country, ISO code (NL). Choose the one that matches what the field holds. The values must be exactly those codes: PV27, not Utrecht, and GM0363, not 363. When the field lists sample values (a model that Cortex drafted records small lists of values), the model compares them with the codes when you save and warns when most of them are not codes of that role; the warning never blocks the save. A field without sample values is not checked: a code the map does not have is then listed under the map instead.
With a map role, a map tile can use the field and the layer follows from the role, and the dashboard assistant offers a map only on a field that has one. When Cortex drafts a model from your source, it proposes a map role only for a field whose name suggests a region and whose sample values are real codes; you confirm it like any other proposal. Choose None to take the role away again.
How do I relate two tables?
Drag from a field of one table to a field of another, or choose New relationship, pick the First field and the Second field and choose Review. Check the direction and the Cardinality (Many to one, One to many, One to one or Many to many) and choose Create relationship. A relationship joins two different tables: the studio refuses a relationship from a table to itself. Remove relationship takes it away again; the two tables stay.
Find your way on a large map
A model with many tables is easier to read through views. The map has filters (Kind, Source, Display folder, Certified only), a Detail control, Focus on a table with its Reach (1 link or 2 links), and Show all. Choose Save view to keep a selection of tables as a named View (New view, Update view, Delete view). A view made with filters is live: new tables that match appear in it by themselves. When you only look at a published model, Save as my view keeps a view that only you see.
See the model as code
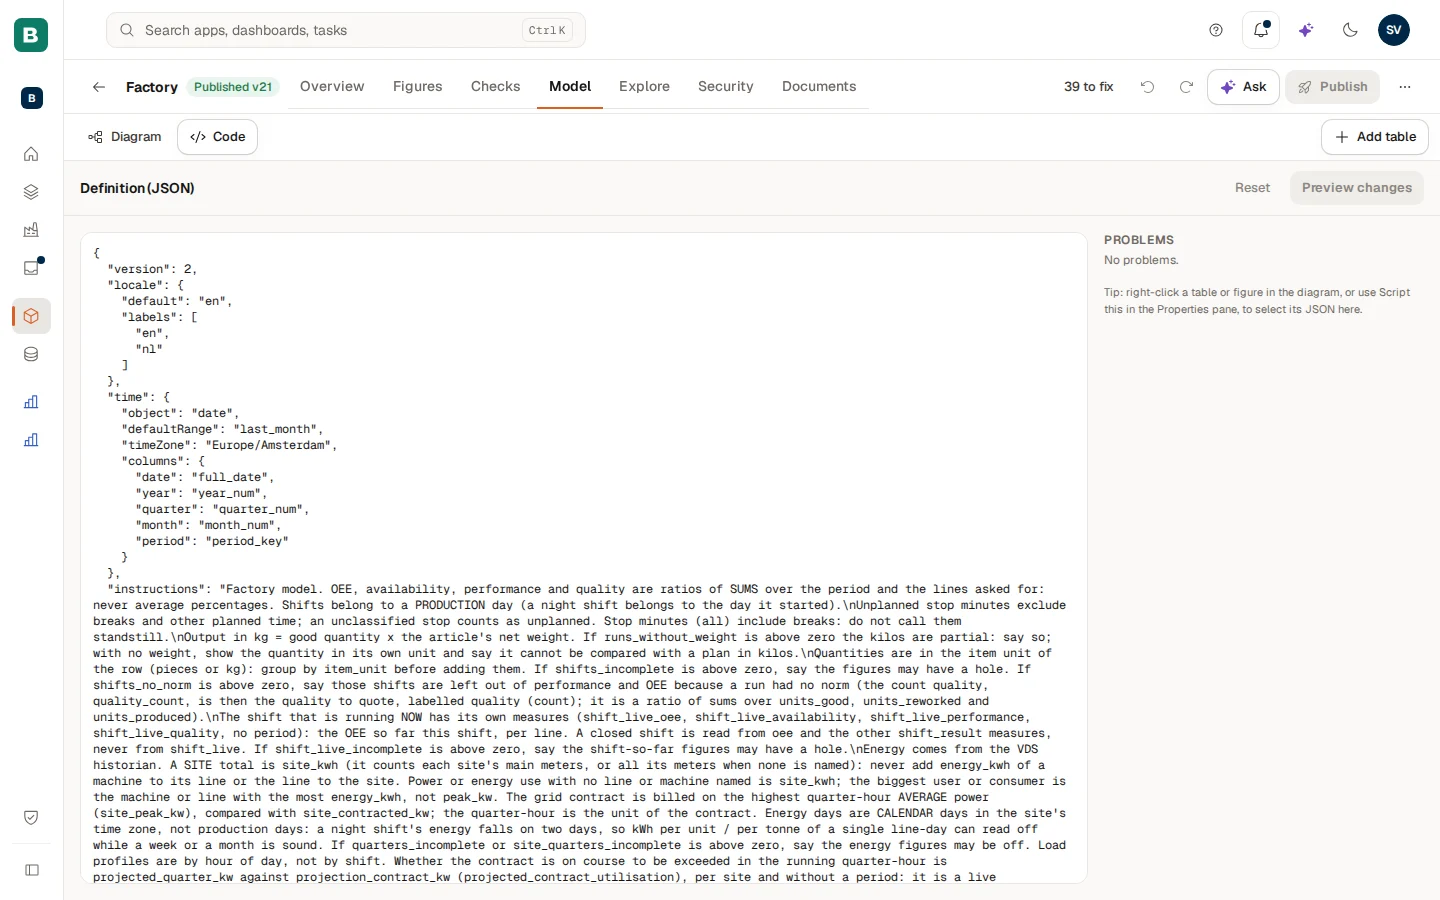
Switch the Model tab to its code view to read and edit the whole definition as Definition (JSON). Edits are checked as you type (Problems, with the line number). Choose Preview changes to see your edit next to the Current draft, Apply to put it in the draft or Reset to throw it away. Nothing is published until you publish. Right-click a table or figure on the map, or use Script this in the Properties panel, to jump to its JSON.
A table on its own page
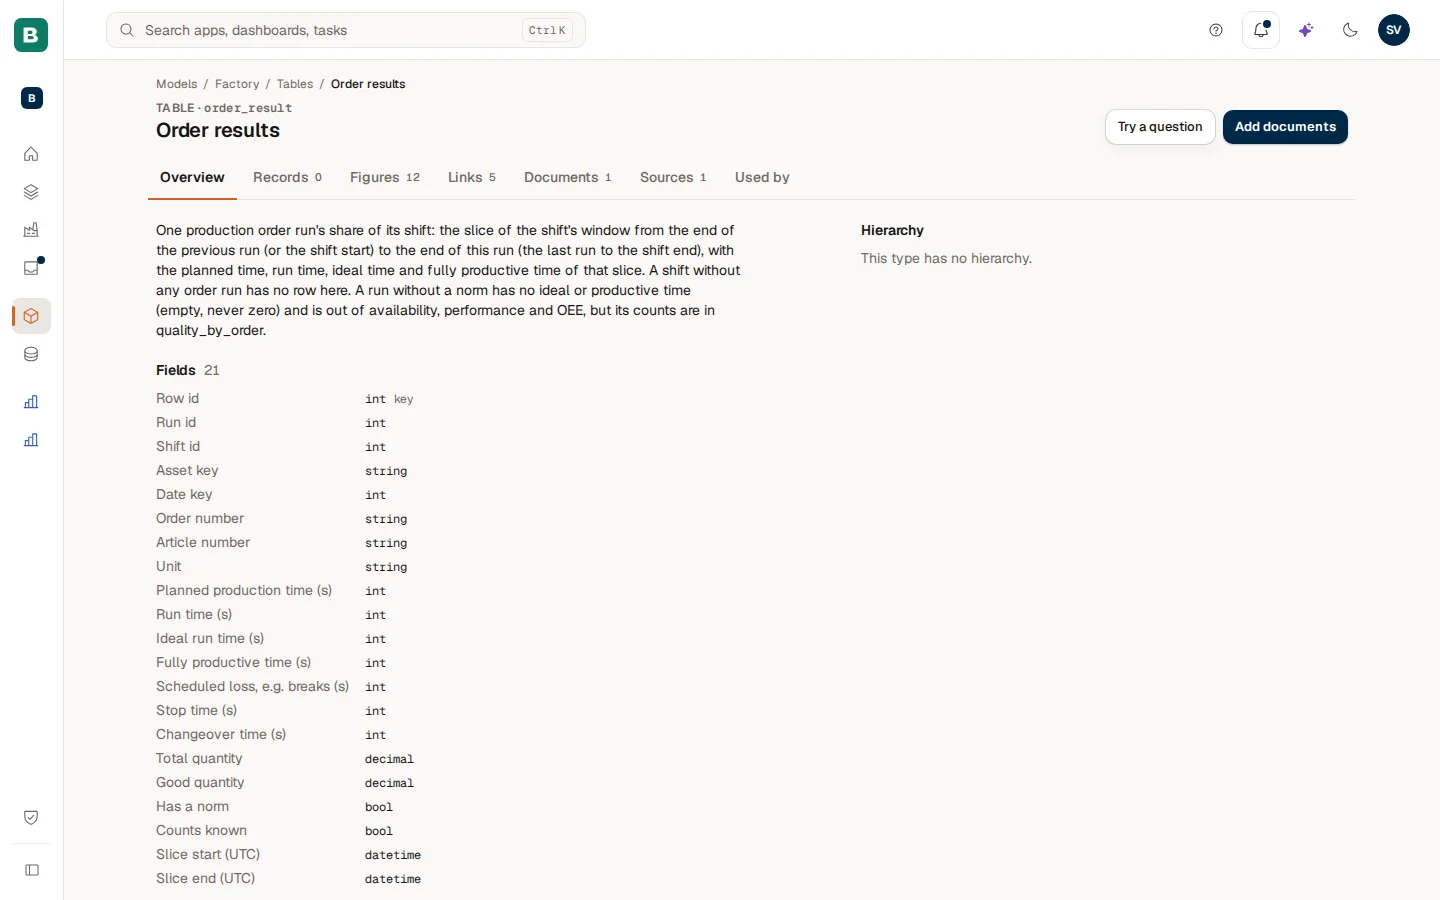
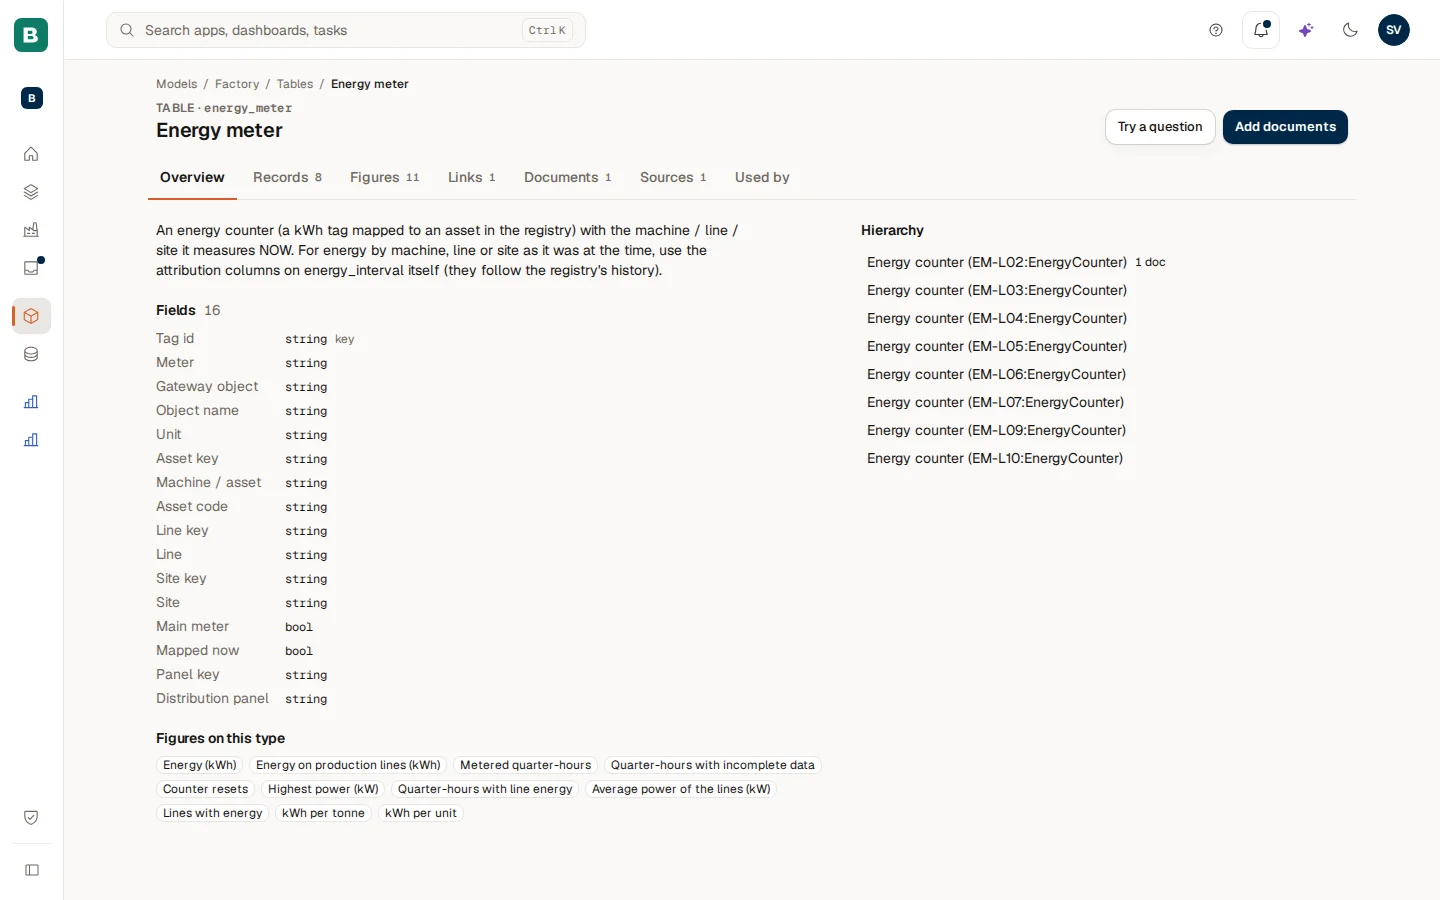
Every table also has its own page, reached with Open table page. It opens on a breadcrumb (Models, the model, Tables, the table) and has the buttons Try a question and Add documents.
| Tab | What it shows |
|---|---|
| Overview | The description, the Fields (with the key), the Figures on this type and the Hierarchy (for example plant, line, machine). |
| Records | The records of the table, with their key. |
| Figures | The figures defined on this table, with their unit and whether they are Certified. |
| Links | The relationships: points to and points here from, the Kind and the Other end. |
| Documents | The documents filed on the table or on one of its records (see Documents and sources). |
| Sources | The source the table is bound to (Primary) and any Enrichment. |
| Used by | What uses the figures of this table. It asks you to publish the model first when that has not happened yet. |
Explore: try a question on the model
The Explore tab is where you check that the model gives the answers you expect, before anyone else relies on it. Owners explore the draft; everyone else explores the published model.
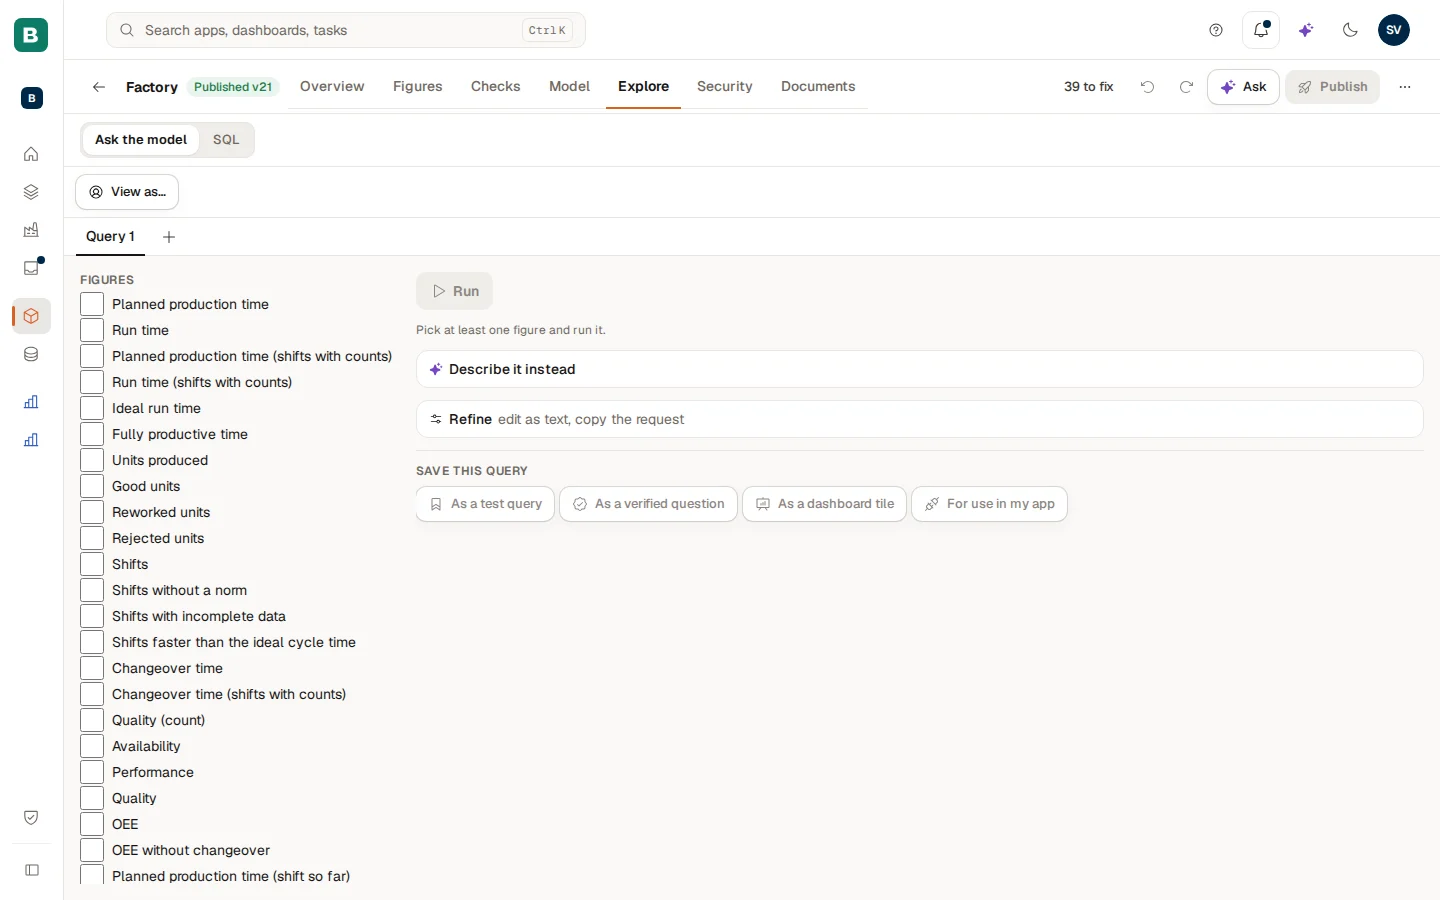
The tab has two modes, Ask the model and SQL.
Build the question
In Ask the model pick one or more Figures, what to Break down by (a field, or Break down over time), Add a condition (Only rows where) and a Time window (All the data, The last…, A named period such as Year to date or Last 12 months, or From … to …). Choose Run. Use the plus button for a second Query in a new tab.
Read the result
The result is a table and a Quick chart. Next to a number, Check opens "Check this number": the statements the model ran for it, which you can run yourself, and the rows behind it (at most 100). It says whether the SQL gives the same number as the certified figure.
Refine it or describe it
Describe it instead lets you write the question in words. Refine shows the question as text that you can edit or Copy as request.
Keep it
Save this query offers As a dashboard tile, For use in my app, As a test query (kept in this browser, per model) and As a verified question. A verified question is checked every night once the model is published.
The SQL mode takes one SELECT statement over the tables of the model (press Ctrl+Enter to run it). The result is labelled "Exploration — not certified", is limited to 1,000 rows and keeps a History. Nothing you run here changes the model or the source.
Security: who may see and use what
The Security tab answers "who and what may use this model?". Rules are draft changes: they are saved in the draft and go live when you publish ("Saved in the draft, live when you publish."). The tenant Admin sees hidden tables and unmasked fields, but row rules and figure rules apply to the Admin too.
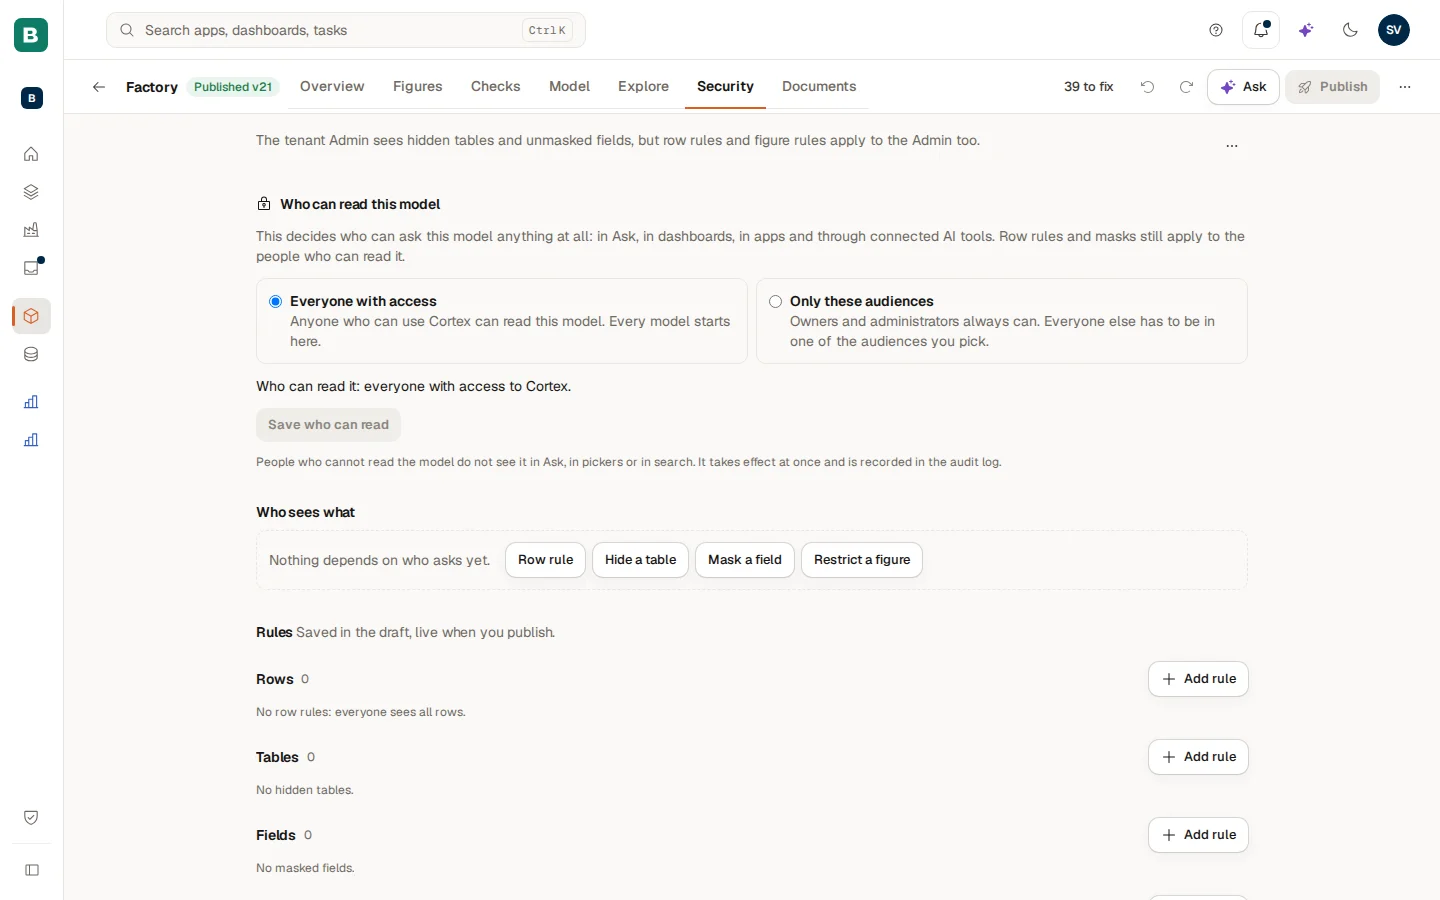
From top to bottom the page holds:
- Who sees what: a matrix of what each kind of reader gets (the Admin, everyone else, a named person, Ask and AI). Choose Show the rule on a cell to jump to the rule behind it, or View as to look at the model as that reader.
- Rules: four lists. Rows (row rules: "show rows where field = the person's attribute"; with none, everyone sees all rows), Tables (Hide a table: hidden from everyone except the audiences or roles you name under Visible to; with no audience only the Admin sees it), Fields (Mask a field, with a mask kind, and who still sees the real value) and Figures (Restrict a figure: Who can use this figure).
- Test as a person: pick You (Admin), A person or An audience, the figures to try and a Reason (kept in the audit log), and choose Run test. It is read-only and audited, and masks stay masked.
- Audiences: groups of people you name with New audience. Add members with Add person, Add group or Add app role (everyone who holds that role in Cortex Control is in the audience). A rule refers to an audience by its exact name, so an audience that a published rule uses cannot be renamed or deleted.
The ... menu at the top right of the page opens two more sections.
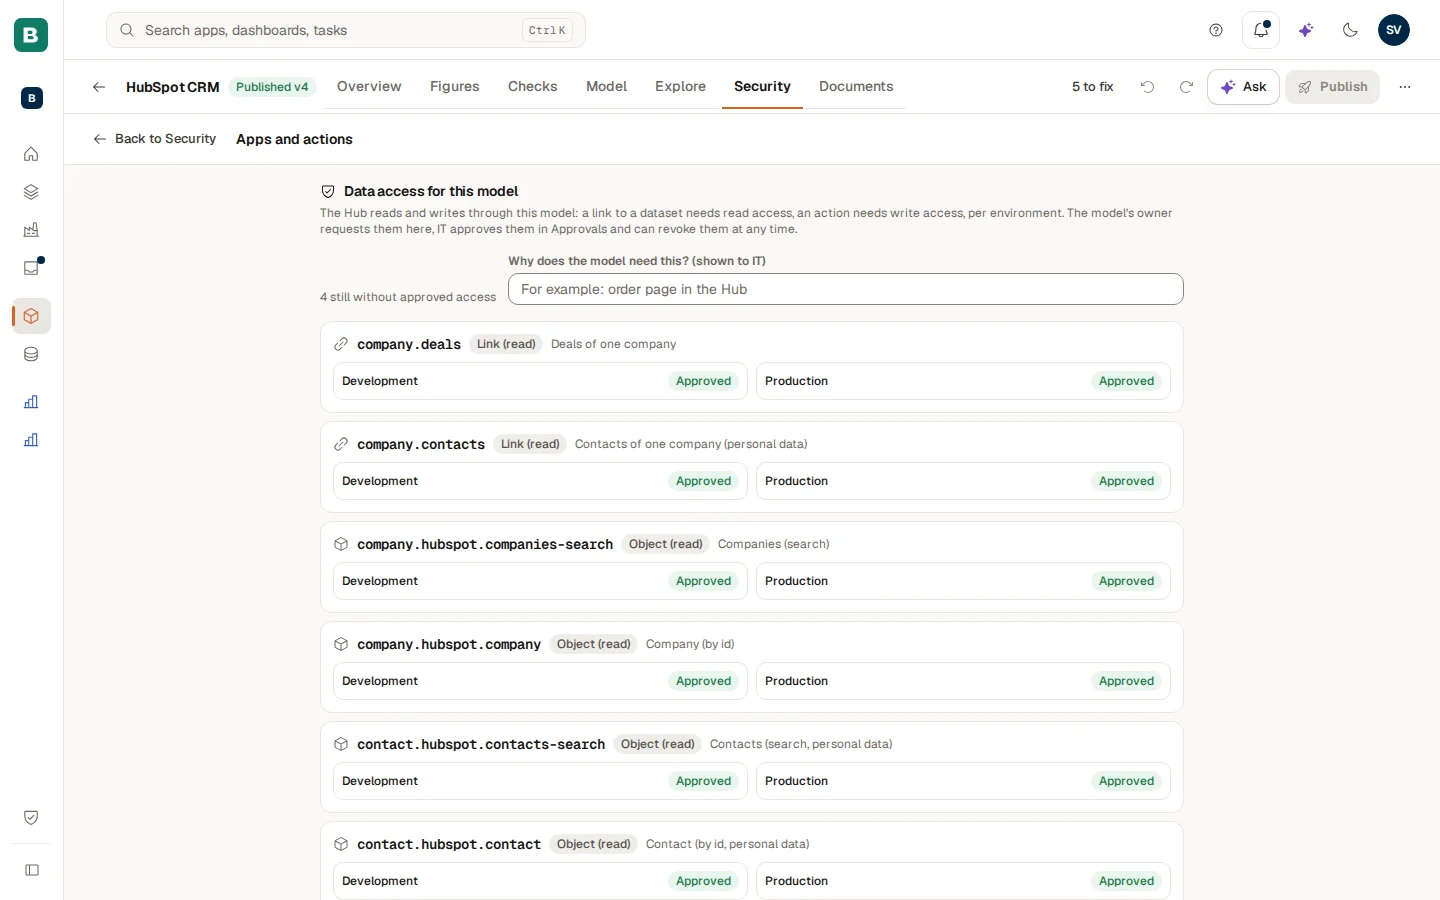
Apps and actions lists the links to datasets (read) and the actions (write) of the model, per environment (Development, Production). The owner requests access here with Request, with a reason that IT sees, and IT approves it in Approvals; IT can revoke it at any time.
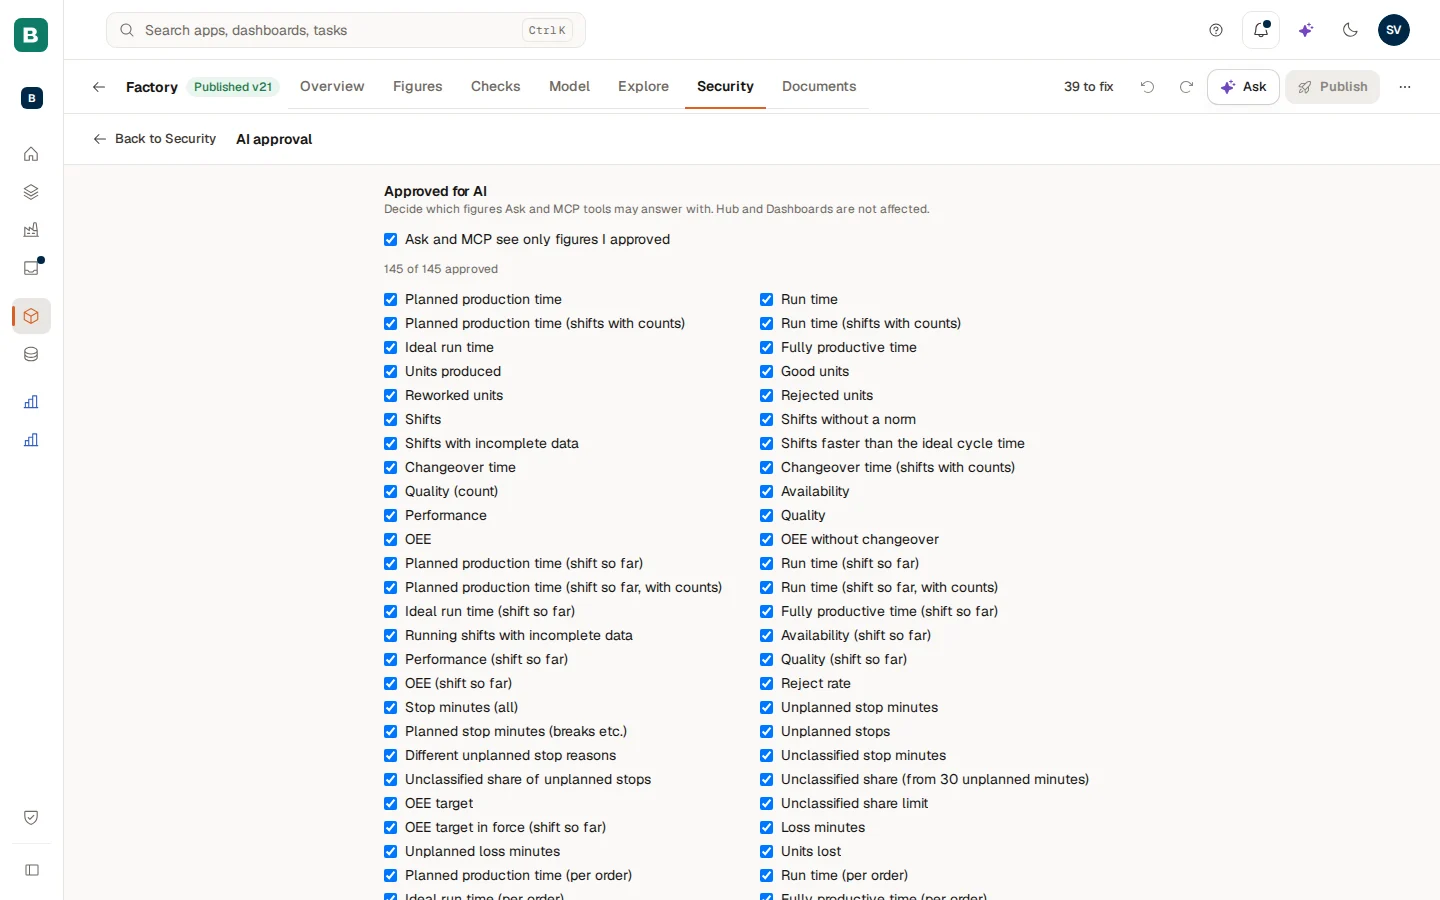
AI approval (Approved for AI) decides with which figures Ask and AI tools (MCP) may answer. Switch Ask and MCP see only figures I approved on and approve figures one by one, or use Approve all described figures. The Hub and dashboards are not affected. Switch to editing first if you only look at the model.
See Access and security for the idea behind these rules.
Documents
The Documents tab is the document library of the model: manuals, procedures and scans that Ask can quote. Adding, filing, searching and erasing documents are covered on Documents and sources.
Health: what to fix next
The status chip in the top bar ("3 to fix", or "Checking… (2 of 9)" while the checks still run) opens Health. It is one list of what to fix next, whatever the source, each row tagged with where it comes from.
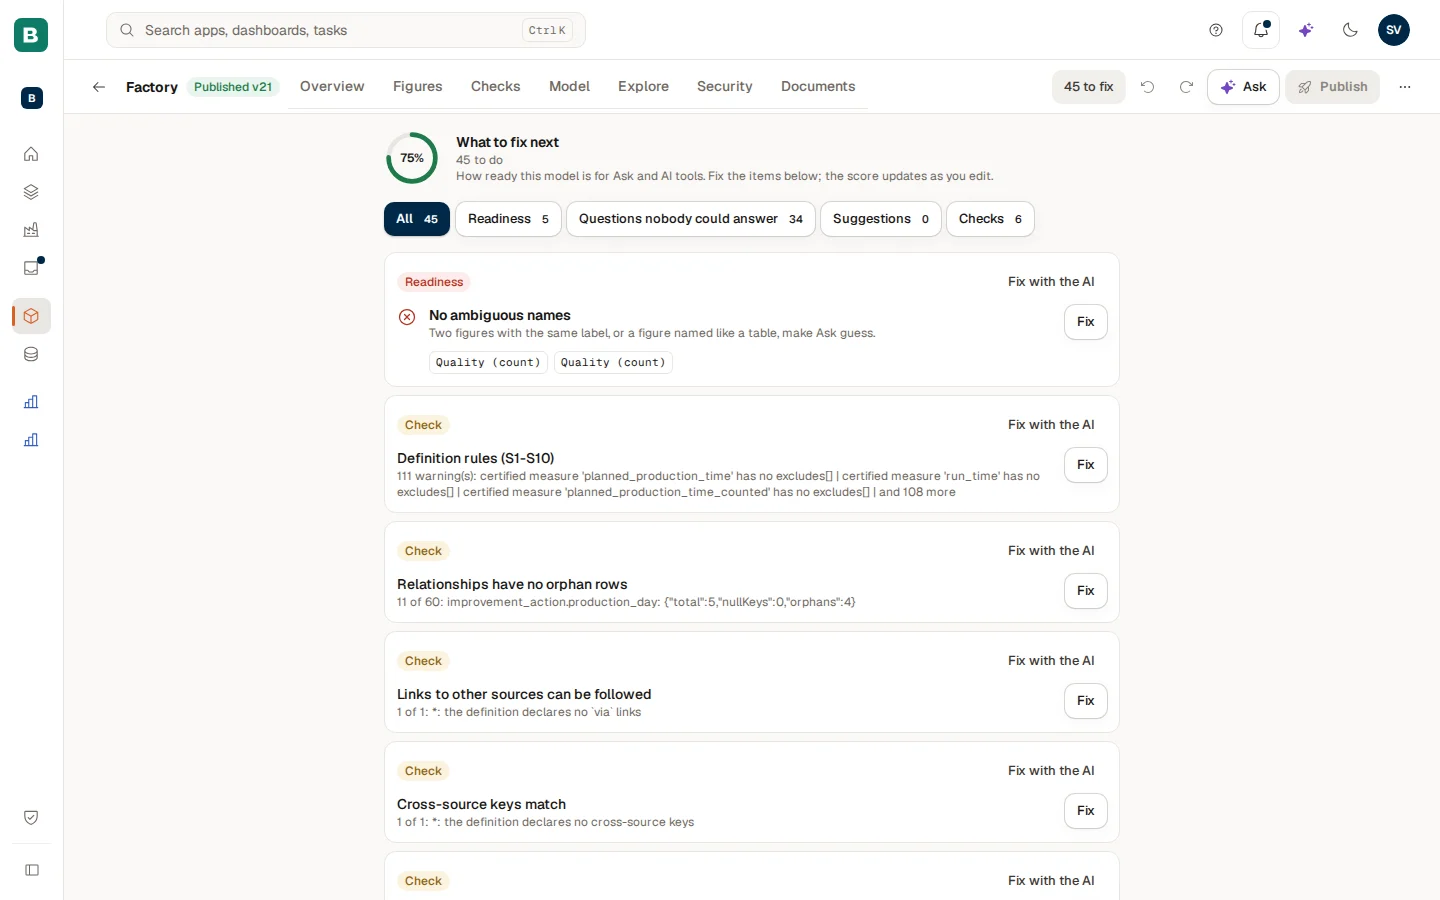
The ring reads "n% ready for AI". Narrow the list with Show: All, Readiness, Questions nobody could answer, Suggestions or Checks.
| Source | What a row means | What you can do |
|---|---|---|
| Readiness | Something that makes the model harder for Ask to use: a missing description, a figure without synonyms, an uncertified figure. | Fix opens the spot. Fix with the AI asks the assistant. |
| Question nobody could answer | Something people asked that the model could not answer ("asked 4 times and not answered"). The type tells why: Unanswered, Refused, Thumbs down, Requested, Failed test, Unknown name. | Draft a fix, Resolved or Dismiss. |
| Suggestion | A change a colleague proposed ("Suggested by …"). | Add to draft or Dismiss. You cannot add your own suggestion: another owner has to. |
| Check | A nightly check that fails (see Model checks). | Open it for the detail. |
| Problem | A problem in the draft itself. | Fix. |
When there is nothing to do, Health says "Nothing to fix here. The model is in good shape."
How do I publish a model?
Choose Publish in the top bar. It opens the Publish tab.
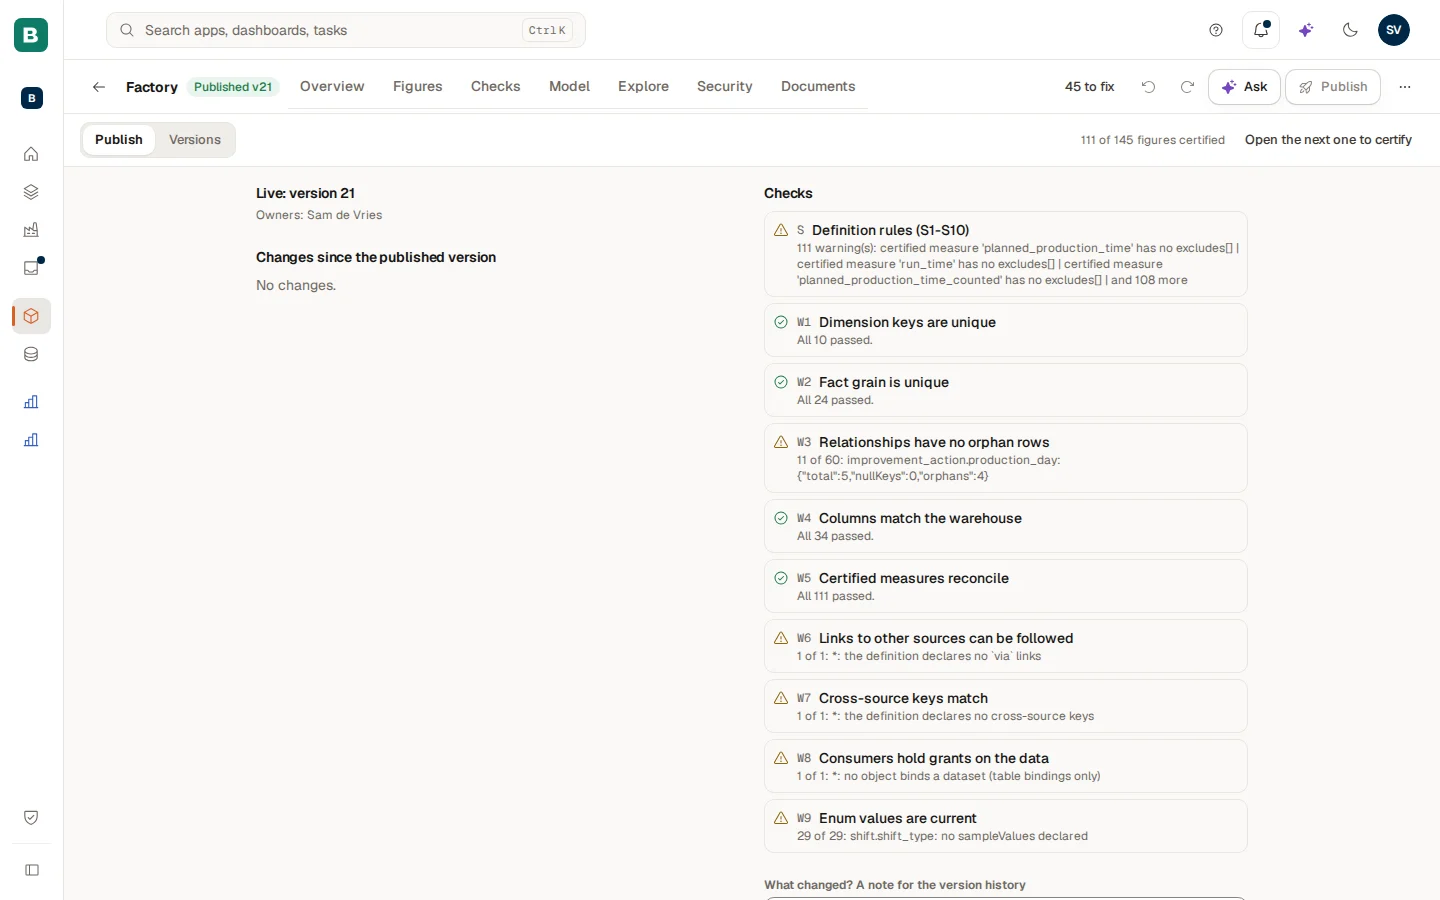
Read what changes
On the left are the Changes since the published version (each marked Added, Changed or Removed), the Risks for what uses this model and Affected: which apps, dashboards and assistants use what you changed. At the top it says which version is live ("Live: version 3") and who the Owners are. Next to the section switch, "n of m figures certified" has a link Open the next one to certify.
Fix what blocks
On the right are the Checks of the draft. A failing check marked Blocking stops publishing: "Fix the failing checks first." While the checks run, the button waits: "Checking… (2 of 9). Publish opens when the checks are done." A model that reads an app's test data shows a warning, which you can still publish through.
Write a note and publish
Write what changed under "What changed? A note for the version history" (the assistant can fill it in for you; read it first) and choose Publish. Publishing makes this version live at once for every app and dashboard that uses the model, and for Ask. Only an owner of the model can publish; for everyone else the tab says so. With no changes the button stays off ("No changes to publish").
A version that was proposed before publishing became one step can still be waiting. The tab then says "Version 3 was waiting from before" and offers Make it live or Discard.
Versions: go back to an earlier state
The Versions section of the Publish tab (the switch at the top) keeps every published version.
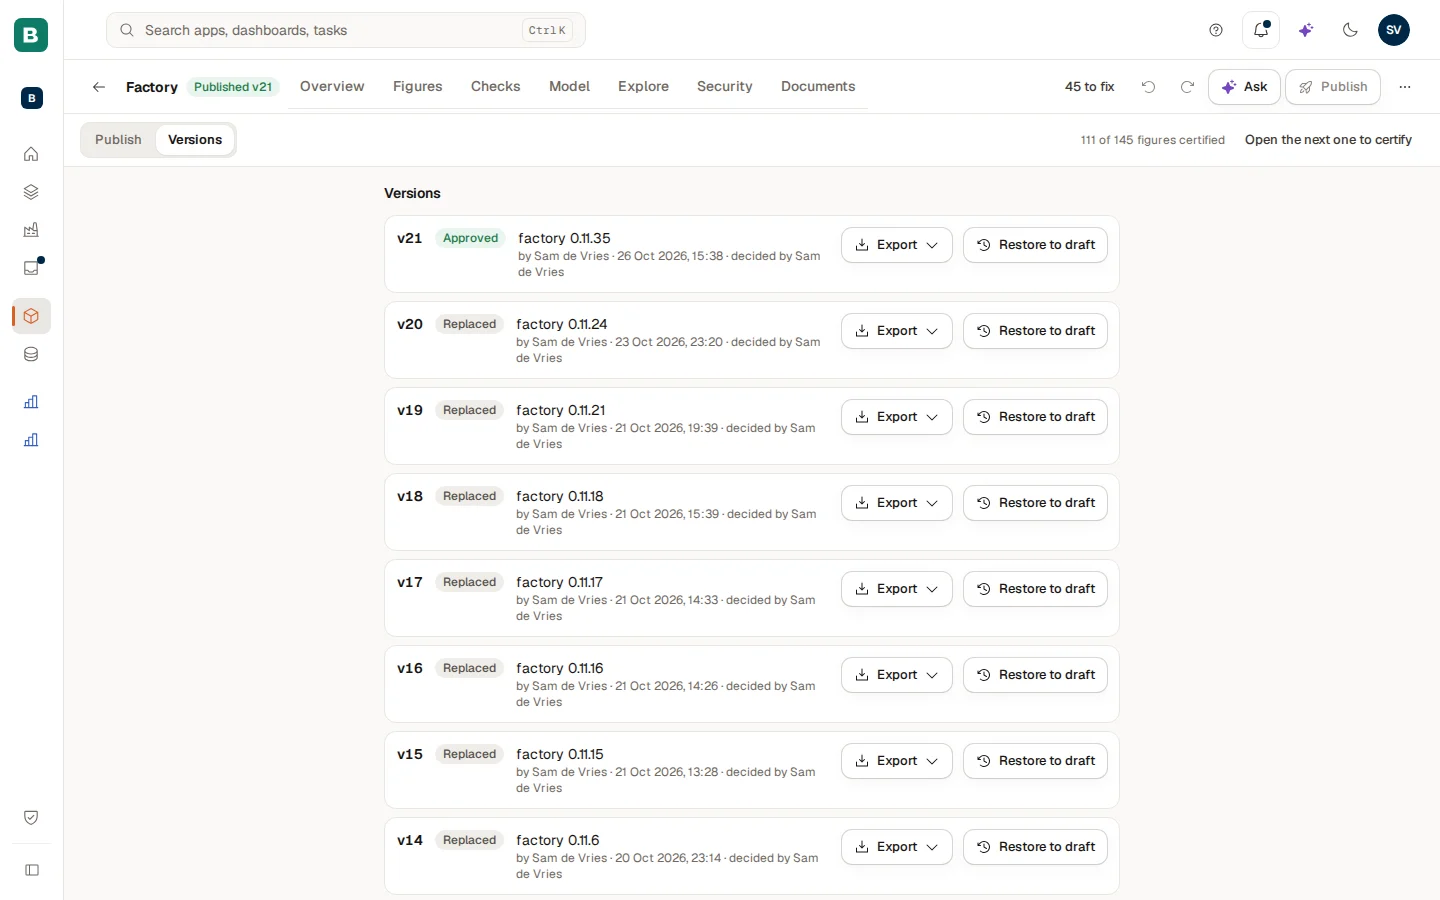
Each version shows its note, who published it ("by Sam de Vries") and, for an admin override, Admin override. Restore to draft brings that version back as your draft, ready to publish again. Export saves it as a Cortex envelope (JSON), an OSI document (YAML) or a Power BI model (TMDL, zip).
How do I see the model as someone who does not own it?
Next to the model an app or dashboard is built on you see Model guide. For people who do not own the model it opens the published model, read-only, exactly as it is for them: a hidden table or a restricted figure is absent. A banner says "Model guide: this is the published model as it is for you." They can save their own views with Save as my view. They do not have the Checks, Health, Publish or the Security rules. Owners and admins see the full studio.
How do I add owners, include another model or archive a model?
Open ... and then Settings (Model settings). Add an owner (for now it asks for the person's Entra object id) or remove one; a model needs at least one owner. Archive model removes it from the list; what already uses its published version is not touched. Includes lets a model include another model's tables and figures; a part that comes from an included model is read-only here, so change it in that model. Export a version and Import a model move a model between installs as a file.
How do I start the company model, and what about names?
On an install that still has separate models, an Admin sees Start the company model at the top of Models. It opens a window that lists what happens before anything changes: which models become sections (ready-made packs are marked; they are managed by the platform from then on), what has to be fixed first (a model that still includes another model), which models stay as they are (a model that uses a name an earlier model already holds is left out of the company model and stays a plain model, with the names and the reason listed; it does not block the start), and what moves (the saved questions of dashboards and apps, the row-access values, the cached results). Owners, readers, drafts, access grants and document libraries stay on their own section, and the old model ids keep working. Nothing is deleted. The start also makes an empty Core section (the shared customers, items and dates), owned by the Admins until the data owner assigns someone. Choose Start the company model and the page turns into the company home. Starting twice changes nothing.
All sections share one name space: a table, figure or relationship name exists once in the whole company model. Names are not secret. When you pick a name that is already taken, the message may tell you that, even if the section that holds it is one you cannot read. Only the fact that the name exists is shown, never its data, its definition or the section it belongs to.
The company model page and its section filter
Once the company model is started, Company model in the Studio group opens one page for the whole company model, at /company-model. Its bar has the tabs Overview, Figures, Checks, Model, Explore, Security and Documents, a Health chip and the Publish button. The Overview is the company home (tables, Sources, Sections, waiting items) with a card for each tab (Figures, Checks, Model, ...); a card opens that tab.
Pick a section in the Sections panel to filter the page to it: a chip Section: <name> appears under the bar and the address gets ?tab=<tab>&in=<section>. The small x on the chip shows all sections again. Next to the chip, Tables and Get data opens that section's tables page, where you get a table from a source. You see it only where you may work on that section's tables: an Admin; an owner of that section who has a Studio seat; or a Builder, unless the section is a ready-made pack. Everyone else does not get the link. Until each tab has its own company screen, a tab lists the sections you may open that tab in, one row per section; sections you may not open there are counted in one line, never named. Publish · N counts the sections you may publish and opens that list (or, with a section filter, that section's Publish tab).
Example: a new product line at Brightwater
Sam de Vries at Brightwater Foods owns the Sales model. The company starts selling a range of oat drinks and wants revenue per product line in dashboards.
- Sam opens Models, opens the Sales model and chooses Add and Add table. Sam picks the product-line table of the sales system. It says In model afterwards.
- On the Model tab Sam drags from the product field of the invoice lines to the key of the new table and chooses Create relationship with cardinality Many to one.
- On the Figures tab Sam describes "revenue per product line" in words, checks the number on Explore and certifies it (see Figures and certification).
- The status chip reads "2 to fix": the new table has no description. Fix opens it; Sam adds one.
- On Publish Sam reads the changes (one table added, one relationship added, one figure added), sees that two dashboards are affected, writes "Product line added" and chooses Publish.
The same evening the checks run on the published version, and the next morning the Overview says "31 of 31 figures proven tonight".
Questions and troubleshooting
Tiles, filters and pages
Add and change tiles by hand, build pivots and drill paths, set periods and filters, use pages, a summary sentence and a phone layout.
Figures and certification
Define a figure, understand its formula, break it down, certify it and keep it certified, so dashboards and Ask can rely on it.